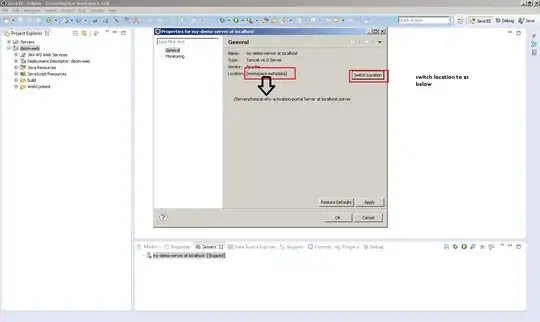
I am working on a tool that has its own debugger. I can select it from the drop-down option in the javascript context in the Chrome console window as shown in the following image.

So, every time I refresh the chrome page, this option resets to "top". For every tiniest change, I have to manually select the debugger from the drop-down option.
Is there any way to change the order in the dropdown menu or if I can save my chrome console setting so that my debugger will be on top instead of the "top" option?
I tried to search any shortcuts of moving up-down in the dropdown menu but found nothing. Any suggestion to minimize my manual work would be highly helpful.