0

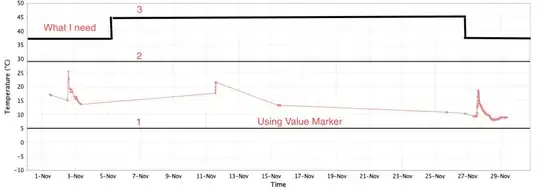
We are using ValueMarker to draw limit lines on the chart (line 1 and 2). How can we draw something like line 3?

enter image description here

I found following ways which are close to what I want but if there is better way to draw this, I would like to use that -

  1. Creating seperate plot for drawing the line 3.
  2. Using Level Renderer to draw something like mentioned in this question.
Abhinav Jain
  • 110
  • 1
  • 5
  • 1
    Also consider [`XYStepRenderer`](https://stackoverflow.com/search?q=%5Bjfreechart%5D+XYStepRenderer); note that a plot may have more than one renderer. – trashgod Feb 10 '22 at 16:21
  • @trashgod Thanks. XYStepRenderer worked perfectly for my use-case. – Abhinav Jain Feb 15 '22 at 05:57

0 Answers0