I'm trying to change bar colours based on value, which is easy enough in JS, but when I implement the code in a TSX file, it gives me an error:
As you can see, VS Code is telling me that dataItem is not a property of target when the file has a TSX extension. If I change the extension to JSX, the code executes and works as expected, but I want to use TypeScript
I'm using the code almost verbatim from the example

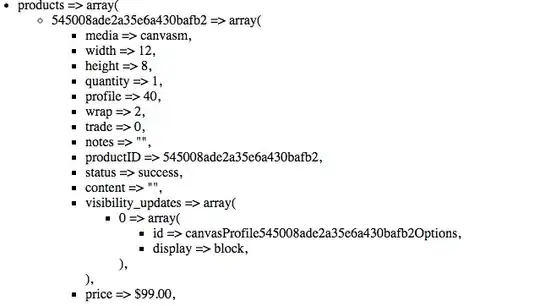
In the example link above, the TS and JS code is identical.
I don't get why the dataItem property of target is recognised in JS but not in TS.
Here is the entire code in my file:
import React, { useEffect } from 'react';

import * as am5 from "@amcharts/amcharts5";
import * as am5xy from "@amcharts/amcharts5/xy";
import am5themes_Animated from "@amcharts/amcharts5/themes/Animated";

import { AxisRenderer } from '@amcharts/amcharts5/.internal/charts/xy/axes/AxisRenderer';

interface IChartData {
     name: string;
     metricName: string;
     value: number
}

interface IChartProps {
    title: string;
    chartData: Array<IChartData>;
    chartContainer: string;
    showLegend: boolean;
    //orientation: am4core.PointerOrientation;
    colorPositiveValues: string;
    colorNegativeValues: string;
    hideValueAxisLabels?: boolean;
    hideCategoryAxisLabels?: boolean;
    hideGridLines?: boolean;
    useCursor?: boolean;
    valueAxisTitle: string;
    showSavedWasted?: boolean;
}


export const StackedBarChart = (props: IChartProps ) => {

    useEffect(() => {

        /* Chart code */
        // Create root element
        // https://www.amcharts.com/docs/v5/getting-started/#Root_element
        let root = am5.Root.new(props.chartContainer);

        // Set themes
        // https://www.amcharts.com/docs/v5/concepts/themes/
        root.setThemes([
        am5themes_Animated.new(root)
        ]);

        // Create chart
        // https://www.amcharts.com/docs/v5/charts/xy-chart/
        let chart = root.container.children.push(
        am5xy.XYChart.new(root, {
            panX: false,
            panY: false,
            wheelX: "panX",
            wheelY: "zoomX",
            layout: root.verticalLayout,
            arrangeTooltips: false
        })
        );

        // Use only absolute numbers
        chart.getNumberFormatter().set("numberFormat", "#.#s");

        // Add legend
        // https://www.amcharts.com/docs/v5/charts/xy-chart/legend-xy-series/
        let legend = chart.children.push(
            am5.Legend.new(root, {
                centerX: am5.p50,
                x: am5.p50
            })
        );

        // Create axes
        // https://www.amcharts.com/docs/v5/charts/xy-chart/axes/
        let yAxis = chart.yAxes.push(
        am5xy.CategoryAxis.new(root, {
            categoryField: "name",
            renderer: am5xy.AxisRendererY.new(root, {
            inversed: true,
            cellStartLocation: 0.1,
            cellEndLocation: 0.9
            })
        })
        );

        yAxis.data.setAll(props.chartData);

        let xAxis = chart.xAxes.push(
            am5xy.ValueAxis.new(root, {
                renderer: am5xy.AxisRendererX.new(root, {})
            })
        );


        createSeries(chart, root, xAxis, yAxis, "value", am5.p100, "right", -3);
        // createSeries("female", 0, "left", 4);

        // Add cursor
        // https://www.amcharts.com/docs/v5/charts/xy-chart/cursor/
        let cursor = chart.set("cursor", am5xy.XYCursor.new(root, {
            behavior: "zoomY"
        }));

        cursor.lineY.set("forceHidden", true);
        cursor.lineX.set("forceHidden", true);

        // Make stuff animate on load
        // https://www.amcharts.com/docs/v5/concepts/animations/
        chart.appear(1000, 100);


    return () => {
        root.dispose();
        };
    }, []);


    // Add series
    // https://www.amcharts.com/docs/v5/charts/xy-chart/series/
    function createSeries(chart: am5xy.XYChart, root: am5.Root, xAxis: am5xy.ValueAxis<AxisRenderer>, yAxis: am5xy.CategoryAxis<AxisRenderer>, field:any, labelCenterX:any, pointerOrientation:any, rangeValue:any) {
        let series = chart.series.push(
            am5xy.ColumnSeries.new(root, {
                xAxis: xAxis,
                yAxis: yAxis,
                valueXField: field,
                categoryYField: "name",
                sequencedInterpolation: true,
                // clustered: false,
                // tooltip: am5.Tooltip.new(root, {
                //     pointerOrientation: pointerOrientation,
                //     labelText: "{categoryY}: {valueX}"
                // })
            })
        );
        console.log('columns', series.columns);
        series.columns.template.adapters.add("fill", function(fill, target) {
            console.log('target', target.dataItem.get("valueX"));   // <- this is where the problem is
            if (target.dataItem.get("valueX") > 0) {
              return am5.color('#a4282a');
            }
            else {
               return am5.color('#3c6eb1');;
            }
          });


        series.columns.template.setAll({
            height: am5.p100
        });

        series.bullets.push(function() {
            return am5.Bullet.new(root, {
            locationX: 1,
            locationY: 0.5,
            sprite: am5.Label.new(root, {
                centerY: am5.p50,
                text: "{valueX}",
                populateText: true,
                centerX: labelCenterX
            })
            });
        });

        series.data.setAll(props.chartData);
        series.appear();


        let rangeDataItem = xAxis.makeDataItem({
            value: rangeValue
        });
        xAxis.createAxisRange(rangeDataItem);
        rangeDataItem.get("grid").setAll({
            strokeOpacity: 1,
            stroke: series.get("stroke")
        });

        let label = rangeDataItem.get("label");
        label.setAll({
            text: field.toUpperCase(),
            fontSize: "1.1em",
            fill: series.get("stroke"),
            paddingTop: 10,
            isMeasured: false,
            centerX: labelCenterX
        });
        label.adapters.add("dy", function() {
            return -chart.plotContainer.height();
        });

        return series;
    }


    return (
        <>
            <div id={props.chartContainer} style={{ width: "100%", height: "500px" }}></div>

        </>
    )

}
