I am writing an R-package and its documentation using roxygen2 to document my functions and pkgdown to create a github page.
The package is about rasters, so I have included some raster plot in the examples of my function documentation.
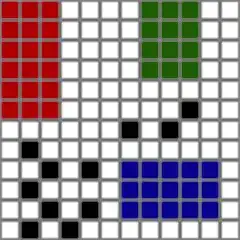
When the examples run in the console everything looks fine. When they run via the pkgdown package (using build_reference() or build_site()) the plot display on the github changes.
This is the correct plot
library(raster)

r <- raster(matrix(1:49, nrow = 7, byrow = TRUE))
plot(r)
text(r)
This is how the plot is rendered on the github page in the reference section.
Note that if the same plots are included in a vignette and not in the documentation they are rendered just fine.
I am a bit at a lost here. Do you have any suggestion on why this is happening and how can I correct this behavior?


