2

I have dataframe full of likelihoods from a model I am using to identify points of interest on a set of images. The rows correspond to an image and the columns correspond to a label. There are "Left" and "Right" versions of the labels. I would like to use the split=True keyword to show the L and R sides on the same violin plot.

I have already created separate violin plots for labels "LH1" and "RH1" as can be seen here:

enter image description here

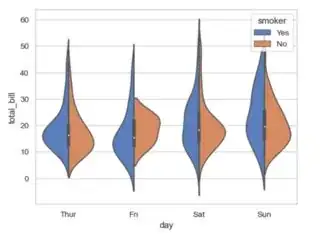
But I am trying to produce a plot with 5 violins, split left and right. Like this example from seaborn:

enter image description here

Seaborn requires a hue parameter which I imagine in my case would be the categorical information "Left" or "Right". As such, I restructured/reshaped my dataframe removing "L" or "R" prefixes in the labels and adding the information as a category under the column "chirality". This is approximately what I have at the moment:

  df = pd.DataFrame.from_dict(
        {'H1': {0: 0.55, 1: 0.56, 2: 0.46, 3: 0.93, 4: 0.74, 5: 0.35, 6: 0.75, 7: 0.86, 8: 0.81, 9: 0.88},
         'H2': {0: 0.5, 1: 0.55, 2: 0.61, 3: 0.82, 4: 0.51, 5: 0.35, 6: 0.58, 7: 0.66, 8: 0.93, 9: 0.86},
         'H3': {0: 0.42, 1: 0.51, 2: 0.86, 3: 0.59, 4: 0.46, 5: 0.71, 6: 0.58, 7: 0.72, 8: 0.53, 9: 0.92},
         'H4': {0: 0.89, 1: 0.87, 2: 0.04, 3: 0.64, 4: 0.44, 5: 0.05, 6: 0.33, 7: 0.93, 8: 0.08, 9: 0.9},
         'H5': {0: 0.92, 1: 0.75, 2: 0.13, 3: 0.85, 4: 0.51, 5: 0.15, 6: 0.38, 7: 0.92, 8: 0.36, 9: 0.76},
         'chirality': {0: 'Left', 1: 'Left', 2: 'Left', 3: 'Left', 4: 'Left', 5: 'Right', 6: 'Right', 7: 'Right', 8: 'Right', 9: 'Right'},
         'image': {0: 'image_0', 1: 'image_1', 2: 'image_2', 3: 'image_3', 4: 'image_4', 5: 'image_0', 6: 'image_1', 7: 'image_2', 8: 'image_3', 9: 'image_4'}})


     H1    H2    H3    H4    H5 chirality    image
0  0.55  0.50  0.42  0.89  0.92      Left  image_0
1  0.56  0.55  0.51  0.87  0.75      Left  image_1
2  0.46  0.61  0.86  0.04  0.13      Left  image_2
3  0.93  0.82  0.59  0.64  0.85      Left  image_3
4  0.74  0.51  0.46  0.44  0.51      Left  image_4
5  0.35  0.35  0.71  0.05  0.15     Right  image_0
6  0.75  0.58  0.58  0.33  0.38     Right  image_1
7  0.86  0.66  0.72  0.93  0.92     Right  image_2
8  0.81  0.93  0.53  0.08  0.36     Right  image_3
9  0.88  0.86  0.92  0.90  0.76     Right  image_4


# This is what I WANT to do.. but seaborn requires and x and y parameter. 
fig, ax = plt.subplots(figsize=(15,6))
sns.set_theme(style="whitegrid")
ax = sns.violinplot(ax=ax, 
                    data=df, 
                    hue='chirality', 
                    split=True)

I've tried many different approaches but I just can't seem to do it. In the attempt above I get ValueError: Cannot use 'hue' without 'x' and 'y' I don't even know what I could set those as despite trying various things and reshaping my dataframe even further. I think I want x as a list of labels, y as the likelihood values and hue to specify L/R. Any help is appreciated!
Tetraquark
  • 33
  • 5

1 Answers1

4

Seaborn works easiest with a dataframe in "long form", which can be accomplished e.g. via pandas' melt(). The resulting variable and value can be used for x= and y=.

import matplotlib.pyplot as plt
import seaborn as sns
import pandas as pd

df = pd.DataFrame.from_dict(
        {'H1': {0: 0.55, 1: 0.56, 2: 0.46, 3: 0.93, 4: 0.74, 5: 0.35, 6: 0.75, 7: 0.86, 8: 0.81, 9: 0.88},
         'H2': {0: 0.5, 1: 0.55, 2: 0.61, 3: 0.82, 4: 0.51, 5: 0.35, 6: 0.58, 7: 0.66, 8: 0.93, 9: 0.86},
         'H3': {0: 0.42, 1: 0.51, 2: 0.86, 3: 0.59, 4: 0.46, 5: 0.71, 6: 0.58, 7: 0.72, 8: 0.53, 9: 0.92},
         'H4': {0: 0.89, 1: 0.87, 2: 0.04, 3: 0.64, 4: 0.44, 5: 0.05, 6: 0.33, 7: 0.93, 8: 0.08, 9: 0.9},
         'H5': {0: 0.92, 1: 0.75, 2: 0.13, 3: 0.85, 4: 0.51, 5: 0.15, 6: 0.38, 7: 0.92, 8: 0.36, 9: 0.76},
         'chirality': {0: 'Left', 1: 'Left', 2: 'Left', 3: 'Left', 4: 'Left', 5: 'Right', 6: 'Right', 7: 'Right', 8: 'Right', 9: 'Right'},
         'image': {0: 'image_0', 1: 'image_1', 2: 'image_2', 3: 'image_3', 4: 'image_4', 5: 'image_0', 6: 'image_1', 7: 'image_2', 8: 'image_3', 9: 'image_4'}})

df_long = df.melt(id_vars=['chirality', 'image'], value_vars=['H1', 'H2', 'H3', 'H4', 'H5'],
                  var_name='H', value_name='value')

fig, ax = plt.subplots(figsize=(15, 6))
sns.set_theme(style="whitegrid")
sns.violinplot(ax=ax,
               data=df_long,
               x='H',
               y='value',
               hue='chirality',
               palette='summer',
               split=True)
ax.set(xlabel='', ylabel='')
sns.despine()
plt.tight_layout()
plt.show()

violinplot from dataframe in long form

Here is another example, using the iris dataset, converting it to long form to show split violin plots of each combination of two species:

import matplotlib.pyplot as plt
import seaborn as sns

iris = sns.load_dataset('iris')
iris_long = iris.melt(id_vars='species')
iris_long['variable'] = iris_long['variable'].apply(lambda s: s.replace('_', '\n'))
sns.set_style('darkgrid')
fig, axs = plt.subplots(ncols=3, figsize=(12, 4), sharey=True)
palette = {'setosa': 'crimson', 'versicolor': 'cornflowerblue', 'virginica': 'limegreen'}
for excluded, ax in zip(iris.species.unique(), axs):
    sns.violinplot(ax=ax, data=iris_long[iris_long['species'] != excluded],
                   x='variable', y='value', hue='species', palette=palette, split=True)
    ax.set(xlabel='', ylabel='')
plt.tight_layout()
plt.show()

violinplots of iris dataset

JohanC
  • 71,591
  • 8
  • 33
  • 66
  • Nice @JohanC. Maybe one day we can train an ML model on all of your helpful melt reformulations and then do it automatically in seaborn :) – mwaskom Jan 25 '22 at 23:17
  • 1
    @mwaskom Maybe something like `sns.violinplot(data=df, x=['H1', 'H2', 'H3', 'H4', 'H5'], y=None, hue='chirality', split=True)` could work one day? Seaborn would need to check whether all strings are existing column names. But sometimes people want to use the melted variable for hue or for facet columns or ... If it were simple, it surely would already be part of seaborn. It keeps amazing me how many non-simple things "just work" in seaborn. – JohanC Jan 25 '22 at 23:52
  • 1
    If `x`/`y` currently only accepted strings that would be worth thinking about but as they also accept vectors of data (including as lists) there is too much ambiguity / potential for surprise. – mwaskom Jan 25 '22 at 23:56