Hi I have a pChart 2 bar chart which contains a variable number of bars and as well as the actual value for each bar I wish to display 2 additional values to the right hand side of each bar. Please consider the image below where the values in the rectangle are an example of the figures I need to add to the chart.
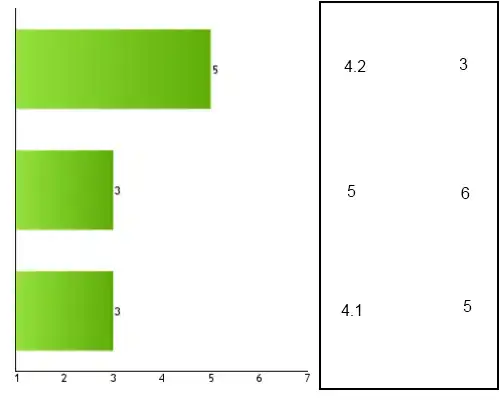
Obviously I want to make them look a bit neater than this but really at the moment I am just wondering
What would be the correct way to do this in pChart?
Is there a built in way to perform this kind of decoration?
If not, how should I best align my additional output with each bar in the chart, considering that these bars are variable in pixel size and data size (i.e. this has to be calculated not approximated for a single scenario).
Just for clarity the extra figures are simply the same scores from previous years and would be decorated in a colour border or similar and included in a legend.
Thanks.