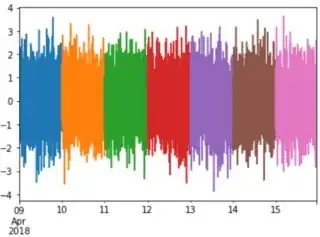
I have a dataframe including random data over 7 days and each data point is indexed by DatetimeIndex. I want to plot data of each day on a single plot. Currently my try is the following:
import numpy as np
import pandas as pd
import matplotlib.pyplot as plt
n =10000
i = pd.date_range('2018-04-09', periods=n, freq='1min')
ts = pd.DataFrame({'A': [np.random.randn() for i in range(n)]}, index=i)
dates = list(ts.index.map(lambda t: t.date).unique())
for date in dates:
  ts['A'].loc[date.strftime('%Y-%m-%d')].plot()
As you can see when DatetimeIndex is used the corresponding day is kept that is why we have each day back to the next one.
Questions:
1- How can I fix the current code to have an x-axis which starts from midnight and ends next midnight.
2- Is there a pandas way to group days better and plot them on a single day without using for loop?


