36

Sometimes (often) I am getting the message Checking for any code updates during debugging:

message

This makes productivity down. I did some research and find a post on the Visual Studio community: https://developercommunity.visualstudio.com/t/visual-studio-gets-stuck-looking-for-code-changes/1521675?viewtype=solutions

But the post was closed with Not Enough Info. It seems the person who posted that, doesn't know how to reproduce this. The same situation with me. I don't know why it is happening. Does anyone have this issue? How to solve this? It is happening in VS 2019 and 2022

Raju Ahmed
  • 1,282
  • 5
  • 15
  • 24
Dilshod K
  • 2,924
  • 1
  • 13
  • 46
  • 4
    Ever since they added this hot reload crap I've had nothing but problems with edit and continue. Our solution is huge, it is a combination of VB.Net, C#, webforms and MVC. Hot reload seems to work OK with C#, but edit and continue with VB is painful, and sometimes locks up the IDE for several minutes at a time. I sincerely wish they would test this stuff better before releasing it out in the wild. I've tried all the suggestions below, and none really work well. – camainc May 23 '22 at 23:51
  • 1
    @camainc Agreed, though I only really came across this PITA when I started using C#; in VB I never had a problem, even with larger solutions. In fact, quite a few things in C#projects are not as good as VB, such as intellisense which is bit buggy in C# in my experience. – SteveCinq Nov 03 '22 at 16:46

7 Answers7

26

I had similar issues just like this, where continuing after hitting the breakpoint would constantly pop that up and delay the debugging sessions tremendously...

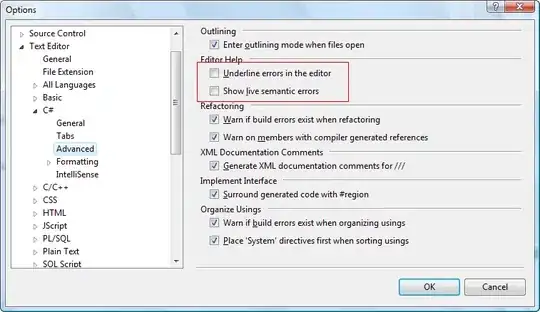
After hours of trying to figure this one out, I think I may have found the solution. I am not sure how your settings are, but this seemed to start happening with me when I started using .NET 6 on Visual Studio 2022 with these settings:

The settings that may affect this

When I turned them off and then restarted Visual Studio, the debugging session got much faster (and that pop-up only showed up once when the breakpoint was hit for the first time in that debugging session and for a very brief moment; afterward, it did not show). So you can give that a try.

However, if you are still experiencing issues with this even after turning these settings off, you might want to turn this setting off in Tools -> Options -> Debugging -> .NET/C++ Hot Reload: Another setting that probably affects this issue
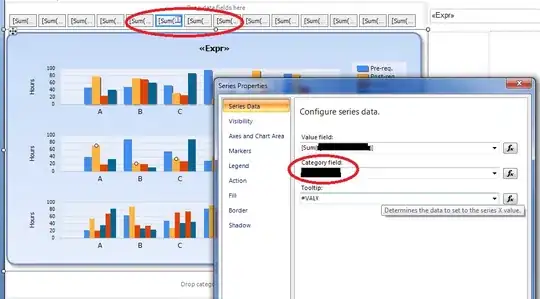
I know turning this particular one probably may not be ideal (since Hot Reload with anything .NET is really useful and cool), but if your productivity is being dragged because of this, then I would suggest this.

Note that I am currently using Visual Studio 2022 with .NET 6.

UPDATE (2/18/2022): It seems that the update to Visual Studio 17.1.0 fixes this issue. I have not seen this popup come up after I upgraded to 17.1.0.

UPDATE (2/25/2022): After using VS 17.1.0 for a week, noticed that this issue persists if you have the Use previews of the .NET SDK turned on. Otherwise, it seems that turning Use previews of the .NET SDK off in Tools -> Options -> Environment -> Preview Features drastically lowers the loading time when Visual Studio is checking for the code changes or makes this Checking for any code updates pop up not show up. And it seems that the Rich Code Navigation feature does not really affect this issue at all.

UPDATE (3/7/2022): I've encountered this issue again and it seems to be happening in a very particular instance. So whenever I've hit a breakpoint and then make an edit and do Edit and Continue, it seems that the Hot Reload searches through the entire project to find any other changes (although the change was only done on one file and one line of code), thus taking longer time on a larger project which in turn bring up this Checking for any code updates popup while Hot Reload looks for changes to recompile. Thus, until the Visual Studio team addresses this performance issue among other things regarding the Hot Reload feature, I would advise turning off this feature if this issue is causing a huge delay in your ability to debug and work on your projects.

For editing Razor files (such as .cshtml or .razor) while you are running the app, I would suggest running it without debugging if you are only making changes to the views. This way you can still utilize Hot Reload while editing the view without encountering this problem.

D.K
  • 511
  • 4
  • 9
  • 2
    I have same problem, also on VS 2022 with .NET 6 (with .NET 5.0 that was OK) – HolaJan Jan 24 '22 at 17:21
  • Although the above suggestions I mentioned seem to work to some extent, I have a feeling that this is a newly introduced performance issue with .NET 6 (and Hot Reload for all .NET code). After testing this further while going through multiple debugging sessions, it seems like VS2022 is still doing this even with those two settings turned off (but with a little bit of seemingly better performance)... Also, not to mention, when I was on .NET Core 3.1 and on the same VS2022, this did not happen at all (and the Hot Reload for all .NET--or the Edit and Continue feature--was still enabled). – D.K Jan 24 '22 at 22:05
  • Unfortunately, it didn't help. Disabling Hot Reload may help, but I need it on debugging. This dialog show up even there is no change in code – Dilshod K Feb 02 '22 at 03:28
  • 1
    Yeah, after weeks of usage, I did notice that this popup still shows up and slows things down during the debug session especially when I had the breakpoints. So I tried a few other things like turning on JIT Debugging for managed code (Tools -> Options -> Debugging -> Just-In-Time -> Managed), caching the symbols, and setting the symbols to "Load only specified modules" (Tools -> Options -> Debugging -> Symbols). After setting these up, although it may still show up, it seemed like the debugging session performance was much better and did not get delayed too much by the popup if it did appear. – D.K Feb 04 '22 at 16:30
  • Where can I find "rich code navigation" ? – Enrico Feb 10 '22 at 10:28
  • 1
    @Enrico You can find it in: Tools -> Options -> Environment -> Preview Features – Raoul Feb 10 '22 at 11:50
  • 1
    After updating to Visual Studio 17.1.0, I am not seeing this issue anymore. – D.K Feb 18 '22 at 19:26
  • 3
    I am seeing this problem on 17.1.2 again :( – Dilshod K Mar 23 '22 at 05:19
  • @DilshodK Actually, I've noticed that, too. And on top of that, it seems that the occurrence of this thing is quite random... On one of the projects, it doesn't do this at all, while on another, it constantly does it even when I am just trying to step over in the debugging session... As I mentioned, the best way forward would be to turn off "Hot Reload" for the debugging session. Also, there is another bug that I've found regarding "Hot Reload" that I've found annoying, and Microsoft says they will fix this issue on .NET 7... Reference for that: https://github.com/dotnet/runtime/issues/59494. – D.K Mar 24 '22 at 18:38
  • Hi, anyone got solution. After update latest vs2022 still every F10 press only showing popup cant work with this :( – Dharmeshsharma Apr 21 '22 at 18:21
  • Still happening in 17.2.0 Preview 4. It only happens for me in large projects. Smaller ones like Azure Function projects, Web Api, etc. it doesn't, but large Asp.NET CORE web applications it happens every single time! – Chris Parker Apr 22 '22 at 00:26
  • Happens on every .. single .. debug step. Every F10 takes 10 seconds. Hope they fix this soon. – Olaf Apr 28 '22 at 11:17
  • I am facing this issue only old one project which is created in vs2019 with .net 5 after that i just upgraded with .net 6 and using vs2022 17.2.1 and getting same popup. Recently new projcte created in vs2022 17.2.1 with and there is no poup. i dont understand why its showing only one project. – Dharmeshsharma May 24 '22 at 08:04
  • 1
    "Load only specific symbols" just did it for me. Thanks @D.K – Haymo Kutschbach Jul 15 '22 at 13:37
  • Started happening for me more noticeably when I introduced an IF DEBUG pre-processor line into my code. Before that it was working gingerly. – T3.0 Sep 02 '22 at 19:31
8

I solved it by unchecking the below option:

Tools-> Options-> Debug > .NET/C+++ Hot Reload -> Enable Hot Reload and Edit and Continue when debugging

Hope it works.

paulsm4
  • 114,292
  • 17
  • 138
  • 190
anand
  • 577
  • 6
  • 11
  • Its work only for CS file but not working in Razor pages its slow down the Razor page debugging – Dharmeshsharma Apr 21 '22 at 18:21
  • Correct path is Tools > Options > Debugging > .NET/C++ Hot Reload Remember you cannot uncheck these settings if you are currently in a debug session - the checkboxes are grayed out. – Will Buffington Aug 08 '22 at 14:48
  • @anand: This worked like a charm for me (MSVS 2022 v17.4.2, Target framework .Net 6, C# + Razor pages) - thank you! – paulsm4 Dec 09 '22 at 22:38
1

It just happened to me while writing an extremely long method. After a while, it started to take ages to do edit and continue. I split the method up to smaller chunks and then all is good again.

I managed to reproduce it afterwards and then it became slow again. I am using Visual Studio 2019.

Krillegeddon
  • 111
  • 6
0

I fixed this by closing all files except for the file(s) I am debugging.

I had a lot of files, including .razor and .razor.cs files open, so I expect that these were incorrectly being scanned for changes.

David Bond
  • 149
  • 1
  • 9
0

I solved it by unchecking the below option:

Tools-> Options-> Debugging > Enable Edit and Continue and Hot Reload

starball
  • 20,030
  • 7
  • 43
  • 238
ABHISHEK Bandil
  • 81
  • 1
  • 10
0

Simply click the arrow next to hot reload icon, then settings then uncheck the hot reload option.it works even for those who are unable to uncheck the option by going to tools->options->debugging...

enter image description here

Yugraaj Sandhu
  • 392
  • 3
  • 14
-1

I have the same issue and I try to solve this since over a year without sucess. Serveral try in option settings doesn't help. The issue starts with VS2017 Desktop Winform framework 4.6.1. Now I am using VS2019 also the virus scanner slow down continueing code change.

Now I realize that: 1 exeption occurs, which is caught by try catch (Output windows report-display only debug info).

after this exception is clear, the code likely to go on much more quicker. hope this can be help someone.

UseCode
  • 1
  • 1
  • Your answer could be improved with additional supporting information. Please [edit] to add further details, such as citations or documentation, so that others can confirm that your answer is correct. You can find more information on how to write good answers [in the help center](/help/how-to-answer). – Community Mar 27 '23 at 13:41