0

So, after Correct, "full length" left-right arrows in Matplotlib?, I realized there is another bit that I find tricky with Matplotlib arrows; consider this example:

import matplotlib.pyplot as plt

fig = plt.figure()
ax = fig.add_subplot()
ax.plot([0],[0])
ax.grid()
ax.set_xlim([0,10])
ax.set_ylim([0,10])
ax.annotate("", (2, 1), (4, 1), arrowprops={'arrowstyle':'<->', 'shrinkA': 0, 'shrinkB': 0})
ax.annotate("", (4, 1), (6, 1), arrowprops={'arrowstyle':'<->', 'shrinkA': 0, 'shrinkB': 0})
plt.show()

Basically, here the first arrow points to the point (x=4, y=1) rightwards as its end, and the second arrow points to the same point leftwards as its start:

matplotlib arrows with grid

... and actually, it does look fine with a grid.

However, if I remove the grid (comment the ax.grid() line), I get this:

matplotlib arrows no grid

So in this case, I can see that the arrowheads pointing to (4,1) from both sides do not touch each other - and I would like them to do so, to give a visual indication that they are both pointing to the same point. If we use an image application to zoom in:

matplotlib arrows zoomed in

... it is clear that the gap between the arrowheads is only one pixel.

Essentially, I would need the opposite of the shrink* parameter (something like "extend") - I couldn't find something like that, so I tried to cheat by giving shrink* negative values, but they produce the same result as the positive values (they explicitly do shrinking).

Is there any way I could achieve this? Just to clarify - I'd hope to obtain the following (that is, the 1-pixel wide gap on previous image, is also drawn):

matplotlib arrows zoomed fake touch

... which when zoomed out, would look like this:
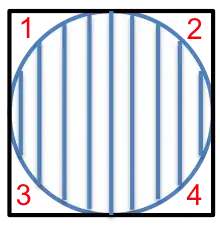
matplotlib arrows fake touch

sdbbs
  • 4,270
  • 5
  • 32
  • 87
  • 1
    I tried your issue, and when I set both outside arrows only, the gap in the center disappeared. So I decided that the default value is set to leave a gap. So, in the arrow properties, I added head_wisdth=0.4 and the arrows almost joined. Try this. `ax.annotate("", (2, 1), (4, 1), arrowprops={'arrowstyle':'<->, head_width=0.4', 'shrinkA': 0, 'shrinkB': 0});ax.annotate("", (4, 1), (6, 1), arrowprops={'arrowstyle':'<->, head_width=0.4', 'shrinkA': 0, 'shrinkB': 0})` – r-beginners Dec 06 '21 at 13:35
  • 1
    The value you add is the default value, but it may be determined by the presence of a setting. More information can be found [here](https://matplotlib.org/stable/api/_as_gen/matplotlib.patches.ArrowStyle.html). – r-beginners Dec 06 '21 at 13:37
  • Many thanks @r-beginners - your suggestion indeed does help: [zoomed in, it can be seen the gap is covered by pixels](https://i.stack.imgur.com/Y6vvQ.png), but I still have an impression that there is a gap, when I view this zoomed out. However, I appreciate very much finally having seen a proper example of how to include `head_width` inside `ax.annotate` - that was evading me a bit. – sdbbs Dec 06 '21 at 14:44

1 Answers1

0

I'm posting this as an answer, simply for readability (otherwise I would have posted it as an edit to OP; had a bit of a hard time finding an example that does this simply):

In the below example, I've tried to manually construct arrowheads from Polygon; and displacing the "tips" of the arrowheads by a small epsilon value, will make them appear to overlap/touch. (The Point class is simply used for readability, to more easily indicate which point coordinates were taken into account). The problem, however, is:

  • At this point, reading that code, I very easily get lost what is first point, what is last point, and in which order do the drawing operations get executed
  • As a consequence of that, one of the custom arrows appears "filled" and "on top" of the line - the other appears "below" the line (in the sense of z-stacking drawing order)
  • When you zoom in that plot, very soon the second line disappears
  • This approach would only work for horizontal arrow lines - anything else would require rotating and/or scaling the polygons (probably something like in Custom arrow style for matplotlib, pyplot.annotate)

That being said, the code is:

import matplotlib.pyplot as plt
import matplotlib.patches as patches
import numpy as np

class Point(object): # https://stackoverflow.com/q/40923522/
  def __init__(self,x_init,y_init):
    super(Point, self).__init__()
    self.x = x_init
    self.y = y_init
    self.itrcnt = 0
  def __iter__(self):
    return self
  def __next__(self):
    ret = None
    if self.itrcnt == 0:
      ret = self.x
      self.itrcnt = 1
    elif self.itrcnt == 1:
      ret = self.y
      self.itrcnt = 2
    elif self.itrcnt == 2:
      self.itrcnt = 0
      raise StopIteration
    return ret
  def next(self):
    return self.__next__()


fig = plt.figure()
ax = fig.add_subplot()
ax.plot([0],[0])
#ax.grid()
ax.set_xlim([0,10])
ax.set_ylim([0,10])

p21 = Point(2, 1)
p41 = Point(4, 1)
p61 = Point(6, 1)

eps = 1e-2
poly21B = patches.Polygon( np.array([(p41.x+eps,p41.y), (p41.x-0.1,p41.y+0.1), (p41.x-0.1,p41.y-0.1)]), facecolor='0.9', edgecolor='0.2', closed=True)
ax.add_patch(poly21B) # must have, else no rendering of poly!
poly41A = patches.Polygon( np.array([(p41.x-eps,p41.y), (p41.x+0.1,p41.y+0.1), (p41.x+0.1,p41.y-0.1)]), facecolor='0.9', edgecolor='0.2', closed=True)
ax.add_patch(poly41A) # must have, else no rendering of poly!
#ax.annotate("", (2, 1), (4, 1), arrowprops={'arrowstyle':'wedge,tail_width=50,shrink_factor=0.5', 'shrinkA': 0, 'shrinkB': 0})
# note: if we thing of pX and pY as start and end points, arrowstyle text arrows are then "opposite"
ax.annotate("", p21, p41, arrowprops={'arrowstyle':'->', 'shrinkA': 0, 'shrinkB': 0, 'patchA': poly21B })
ax.annotate("", p41, p61, arrowprops={'arrowstyle':'<-', 'shrinkA': 0, 'shrinkB': 0, 'patchA': poly41A })
plt.show()

This results with:

matplotlib example

Zoomed in on pixels, the overlap of arrowtips seems decent:

matplotlib example pixel zoom

... however, if I do a ("data") zoom from within Matplotlib, the right line eventually disappears:

matplotlib example right line gone

... so this is not really a "production ready" solution.

sdbbs
  • 4,270
  • 5
  • 32
  • 87