1

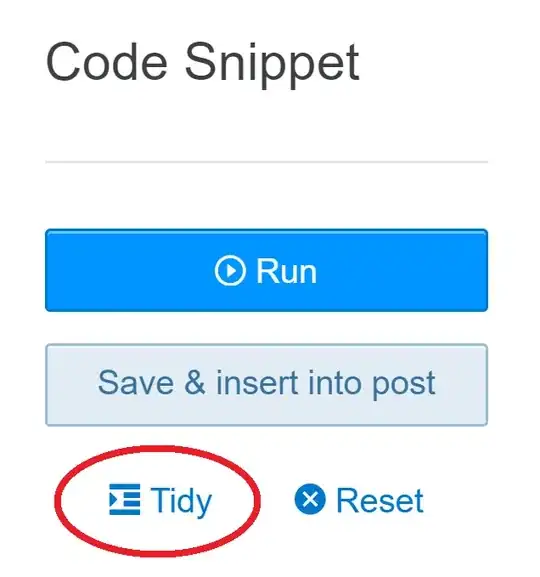
I generated this graph with ggplot2, (I manually added red rectangle)

enter image description here

I want to somehow "label" the x - axis intervals.

For example; from 1.45e+08. to 1.46e+08 is named as "low" , 1.46e+08. to 1.47e+08 as "mid" and I only want tho show this lables on x-axis rather than values.

I have the list for every point which label/interval it belongs to , and if it is useful the interval of that range's initiation and ending point.

I used this code when generating the graph

ggplot(erpeaks, aes(x=pos, y=score), position=position_jitter(w=0,h=0)) + 
  geom_point(stat = "identity", width=0.5, aes(colour = factor(label)))  +
  theme(plot.title=element_text(hjust=0.5))

I tried to add this, but his only works for determining the intervals

 coord_cartesian(xlim = c(144018895.5,146957774.5))

And also this one but this is not giving result.

scale_x_discrete(c(144018895.5,146957774.5),labels = c("low")) 

Thank you.

juylmin
  • 47
  • 7

1 Answers1

3

You can use the cut() function in facet_grid() to show certain invervals in certain facets.

library(ggplot2)
#> Warning: package 'ggplot2' was built under R version 4.1.1

ggplot(iris, aes(Sepal.Width, Sepal.Length, colour = Species)) +
  geom_point() +
  facet_grid(~ cut(Sepal.Width, c(-Inf, 2.75, 3.75, Inf)),
             scales = "free_x", space = "free_x")

If you want to assign different labels, you can relabel the cut beforehand.

df <- iris
df$facet <- cut(df$Sepal.Width, c(-Inf, 2.75, 3.75, Inf))
levels(df$facet) <- c("low", "medium", "high")

ggplot(df, aes(Sepal.Width, Sepal.Length, colour = Species)) +
  geom_point() +
  facet_grid(~ facet,
             scales = "free_x", space = "free_x")

Created on 2021-11-30 by the reprex package (v2.0.1)

teunbrand
  • 33,645
  • 4
  • 37
  • 63
  • 1
    Do you mean something like the following? `+ geom_hline(yintercept = your_interval_breaks, linetype = "dashed")` – teunbrand Nov 30 '21 at 09:09
  • Hello again! @teunbrand . Thank you again for the help. I was using this method perfectly, however now with another dataset it is not working. It draws perfect scatter plot until I add this exact code ; " facet_grid(~ facet, scales = "free_x", space = "free_x") " . After this all the dots disappearing and nothing is as a dot. If you could give me any idea about the possible reasons of that I would appreciate. – juylmin Feb 13 '22 at 23:04
  • Okay apparently the "not working" part is only the space argument with = "free_x". Without this, the ranges are not appearing proportionally to their length of interval. So every interval looks the same (but normally they are not equal). I still could not solve this – juylmin Feb 13 '22 at 23:31