1

Is there a way / tool to collect detailed Stacktrace for SAP Function Module executions?

We are seeing intermittent performance issues in an application. It is calling a SAP FM (using PyRFC). This FM itself performs many things - logic, further calls, etc. Also it applied a multithreaded processing. It is for fetching price of multiple items. For each invocation, it splits the call by items, and executes in parallel threads for each item, waits till all threads are finished, combined all prices fetched and returns result.

Very low percentage of these calls are taking much longer than usual (99% of calls are less than 2 seconds whereas slow calls are >10s)

With tracing enabled at different layer, we see that calls are split between multiple SAP app servers as expected. For the sudden slow calls, one of the app server ends up taking huge amount of time, thereby making overall execution slow.

We carefully verified that this is not problem with a specific app server. It is rather happening randomly across many app servers. We are unable to pinpoint what condition is causing this. From available app server metrics (CPU, memory, I/O etc) are within very healthy limits during same timespan.

Two questions I have are -

  1. Is there a way to enable details tracing at SAP app server level; revealing detailed trace of exactly what is happening on a specific app server during one of these slow execution? For example one of the slow calls took 7.8 seconds. But we do not have more breakup of how exactly that 7.8 seconds were spent; what all went into it.
    I am looking for something similar to stacktrace and profiling that can be done with a JVM application. Without next level breakup of this 7.8 seconds, it is like throwing stones in dark and hoping it would hit somewhere.

  2. Has anyone faced similar issue before ? If yes, what has been root cause in that case?
    To avoid confusion, not looking for a magic solution. With such problems and high level details that is available, it is not possible to offer a solution. So I am looking for insights if you have seen similar issues in past and what was the reason then, so that we can check same just to be sure. Or if you can suggest any other ideas to explore for root cause analysis, that is helpful too.

Regards. S. Das
Suncatcher
  • 10,355
  • 10
  • 52
  • 90
sdas
  • 23
  • 8
  • 1
    I don't know `pyRFC`, but generally RFC SDKs offer the Unit RFC with "SAT trace" (maybe search "sattrace" or "sat_trace" in the `pyRFC` or NW RFC documentation). SAT corresponds to a tool in the backend which saves the list of all executed ABAP procedures and durations. I don't know how you can retrieve the results with RFC SDKs. That said, I think it's best that you log in the ABAP backend or database which have adapted tuning tools, or ask experienced people to do that for you. – Sandra Rossi Nov 26 '21 at 09:28

1 Answers1

0

You have several options here:

  1. Legacy way stack trace or call graph via SE37

enter image description here

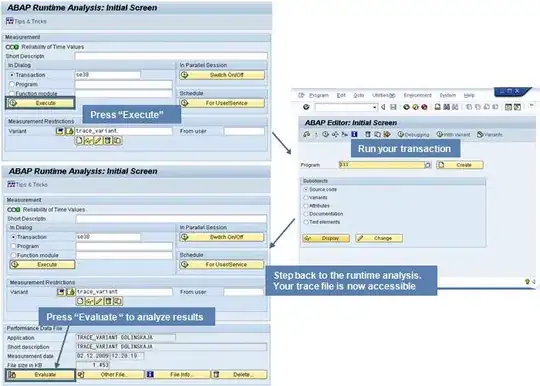
  1. SAT runtime analysis of FM building blocks

enter image description here

  1. SAP ST12 Single transaction analysis a more comprehensive and extended tool

enter image description here

Can be run for tracing external calls! Your tool of choice!

  1. SAP UPL Usage & Procedure Logging

Tracing tool that allows break down your FM into subroutines and even logic pieces (IF, LOOP, WHILE, CASE) and how are the match to each other

enter image description here Activated in transaction /SDF/UPL_CONTROL

Available since SAP Netweaver 7.01 SP10 or 7.02 SP9 + Kernel 720 Patch 94 or 7.31 SP3 and 7.40

ST-PI 2008_1_x SP4 is required

  1. ABAP SCMON, the successor of UPL. Allows the same as UPL, additionally
  • Catch also any dynamically called ABAP routines
  • Supports all ABAP procedure types down to subroutines
  • Records call stack information as well by recording the corresponding root

enter image description here

Activated in transaction SCMON or /SDF/SCMON_ACTIVATE

Available as of NW 7.22 PL123 or NW 7.42 PL310 or NW 7.45+ or NW 7.50+

ST-PI 2008_1 SP14 or ST-PI 740 SP4 are required

  1. SAP CCLM (Custom Code Life Cycle Management) a more comprehensive tool that contains all the functionality of 4 and 5 plus runtime performance analysis.

Though, it requires Solution Manager 7.2.

Here is the overview how they stand again each other by features

enter image description here

I want to note that options 4 and 5 are not runtime analysis, so they cannot say how the module behaves per-variant i.e. on certain test data, but they allows to understand the structure and possible bottlenecks.

Suncatcher
  • 10,355
  • 10
  • 52
  • 90