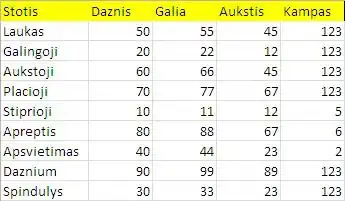
I'm tiring to plot contour map like picture is following below , i can plot the contour, but problem is with shadow area on contour . actually i have 4 vector data [x,y,z,k]. x,y area coordinates and z , k are levels . my code:
sample=xlsread('sample.xlsx');
x=(sample(:,1));
y=(sample(:,2));
z=(sample(:,3));
k=sample(:,4);
N=50;
[X,Y]=meshgrid(linspace(min(x)-0.2, max(x)+0.2, N), linspace(min(y)-0.2, max(y)+0.2, N));

F = scatteredInterpolant(x, y, z);
FF=scatteredInterpolant(x, y, k);
Z= F(X,Y);
ZZ=FF(X,Y);

contour(X,Y,Z,'ShowText','on') %main contour
hold on
???? shadow???

