0

I have a PHP project on a Windows Server 8 and I want to be able to work with those pages from VS Code and make step debugging but I don't know how to configure the launch.json correctly.

I installed Xdebug 3 on the Windows Server and it's active. The configuration that I put in php.ini is this one:

[XDebug]
zend_extension = xdebug
xdebug.mode= debug, develop
xdebug.start_with_request=yes
xdebug.idekey=VSCODE
xdebug.remote_port = 9003
xdebug.discover_client_host = true
xdebug.client_discovery_header = HTTP_XDEBUG_IP
xdebug.show_exception_trace = 1
xdebug.connect_timeout_ms = 5000

Take into consideration that:

  • "11.128.7.124:3555" is the IP Windows server and port used by Apache on that server.

  • I open the server PHP Folder from VS Code throw a network unit.

  • In the Windows 8 server is installed XAMPP with PHP 7.2

I've read a lot of information but I've being able to configure the environment to do the step debugging that I can do when I open that project locally.

I also installed Xdebug extensions in Microsoft Edge and Google Chrome browsers (active).

The launch.json file on VS Code has this configuration (No the same IP address and port):

{
    // Use IntelliSense to learn about possible attributes.
    // Hover to view descriptions of existing attributes.
    // For more information, visit: https://go.microsoft.com/fwlink/?linkid=830387
    "version": "0.2.0",
    "configurations": [
        {
            "name": "Launch Built-in web server",
            "type": "php",
            "request": "launch",
            "runtimeArgs": [
                "-dxdebug.mode=debug",
                "-dxdebug.start_with_request=yes",
                "-S",
                "11.128.7.124:3555"
            ],
            "program": "",
            "cwd": "${fileDirname}",
            "port": 9003,
            "pathMappings": {
                "d:/xampp/htdocs/myproject": "${workspaceFolder}/htdocs",
                "/myproject": "${workspaceFolder}"
              },
            "serverReadyAction": {
                "pattern": "Development Server \\(http://localhost:([0-9]+)\\) started",
                "uriFormat": "http://localhost:%s",
                "action": "openExternally"
            }
        },
        
        {
            "name": "Launch currently open script",
            "type": "php",
            "request": "launch",
            "program": "${file}",
            "cwd": "${fileDirname}",
            "port": 9003,
            "runtimeArgs": [
                "-dxdebug.start_with_request=yes"
            ],
            "env": {
                "XDEBUG_MODE": "debug,develop",
                "XDEBUG_CONFIG": "client_port=${port}"
            }
        },

        {
            "name": "Listen for XDebug",
            "type": "php",
            "request": "launch",
            "port": 9003
        }

    ]
}

Here is the xdebug_info() function output:
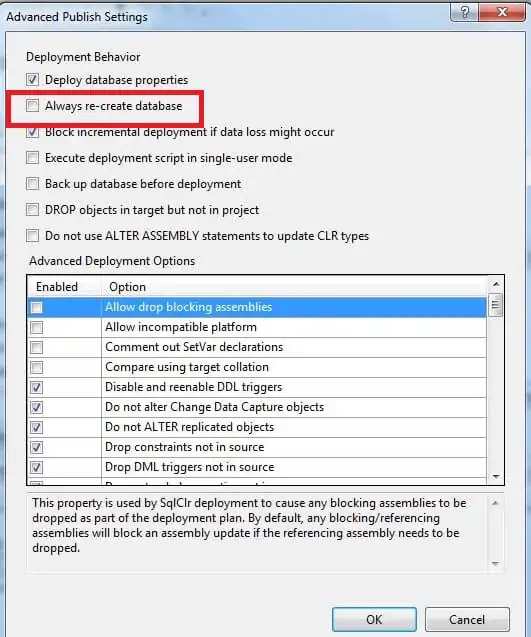
Xdebug output 1/3
Xdebug output 2/3
Xdebug output 3/3

1 Answers1

1

I think your problem is:

xdebug.remote_port = 9003

The setting has been renamed in Xdebug 3 to xdebug.client_port (https://xdebug.org/docs/upgrade_guide#changed-xdebug.remote_port).

Alternatively, you can modify launch.json, so that it also sets the port to the port setting of the same launch configuration in the "Launch Built-in web server" case.

        "runtimeArgs": [
            "-dxdebug.mode=debug",
            "-dxdebug.start_with_request=yes",
            "-dxdebug.client_port=${port}",
            "-S",
            "11.128.7.124:3555"
        ],

Tips

In order to debug issues with Xdebug debugging, you can use the new Xdebug 3 function xdebug_info() in a script that you're trying to debug, and it will show you diagnostics on what's going on, what Xdebug has tried, and whether it could connect to the debugger, among other things.

Derick
  • 35,169
  • 5
  • 76
  • 99
  • You are right @Derick, it was indicated in [xdebug upgrade guide](https://xdebug.org/docs/upgrade_guide) but I missed it. I've already changed it, but even when xdebug recognize my IP address it doesn't work. – Lornis Hervilla Nov 15 '21 at 22:10
  • The xdebug_info() output says that the Xdebug connected to the client... so it seems to be working fine. Have you perhaps not set a breakpoint? Perhaps turn on "Break on first line"? – Derick Nov 18 '21 at 00:23
  • Yes @Derick, I've setted the breake points as I've done before when I make step PHP debugging, the different this time is that I used to do it from WSL2 in my own computer. This is the first time I'll try to do it in a Windows Werver. I think the problem is in the launch.json file config. I'm not sure how to set those parameters and I don't find any explanation. I just found this NodeJS guide [Debugging](https://code.visualstudio.com/docs/editor/debugging#_remote-debugging) – Lornis Hervilla Nov 18 '21 at 20:34