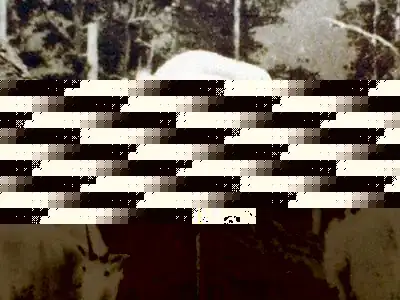
I want to create a timeline plot that roughly resembles the example below: lots of overlap at some points, not a lot of overlap at others.
What I need: overlapping images should repel each other where necessary, eliminating or reducing overlap. Ideally I'd be able to implement either a vertical or horizontal repel.
library(tidyverse)
library(ggimage)

test_img <- list.files(system.file("extdata", package="ggimage"), pattern="png", full.names=TRUE)

set.seed(123)

df <-
  tibble(date = as.Date(paste0("2020-", round(runif(45, 1, 2)), "-", round(runif(45, 1, 10)))),
       group = paste0("Timeline ", rep(1:9, each = 5)),
       img = sample(test_img, size = 45, replace = T) )

df %>%
  ggplot() +
  geom_line(aes(x = date, y = group, group = group), size = 5, alpha = 0.2) +
  geom_image(aes(x = date, y = group, image = img, group = group), asp = 1)

Something similar to the repelling in ggbeeswarm::geom_beeswarm or ggrepel::geom_text_repel would be nice, but those don't support images. So I think I need to pre-apply some kind of 1-dimensional packing algorithm, implementing iterative pair-wise repulsion on my vector of dates within each group, to try to find a non-overlapping arrangement.
Any ideas? Thank you so much!
Created on 2021-10-30 by the reprex package (v2.0.1)

