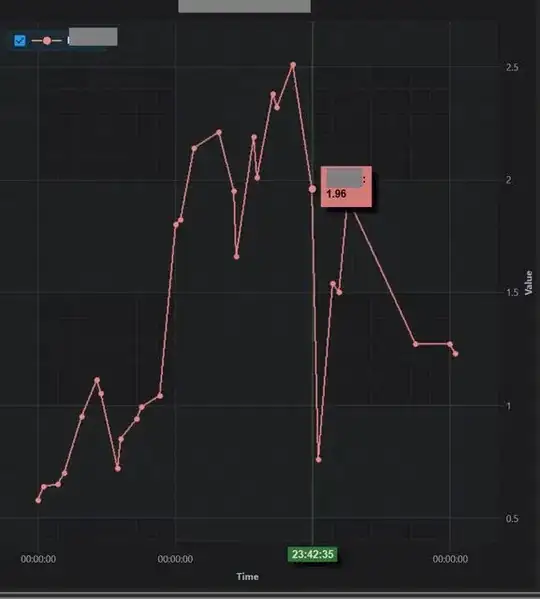
I have a SciChart surface that is bound to an ObservableCollection<IRenderableSeriesViewModel> named TrendSeries. My DataSeries type is XyDataSeries<TimeSpan, double>.
My X-Axis is showing correctly when my timespan range is less than 24 hours. When I plot points that have a TimeSpan value of greater than 24 hours, the X-Axis (Time) incorrectly shows a range of 00:00:00 to 00:00:00.
How can I get my X-Axis to show correctly when I am plotting values with a TimeSpan greater than 24 hours?
<s:SciChartSurface RenderableSeries="{s:SeriesBinding TrendSeries}">

        <!-- Define X Axis -->
        <s:SciChartSurface.XAxis>
            <s:TimeSpanAxis AxisTitle="Time"
                            AutoRange="Always" GrowBy="0.1, 0.1"
                            AxisAlignment="Bottom"/>
        </s:SciChartSurface.XAxis>

        <!-- Define Y Axis -->
        <s:SciChartSurface.YAxis>
            <s:NumericAxis AxisTitle="Value" AutoRange="Always" GrowBy="0.1, 0.1"/>
        </s:SciChartSurface.YAxis>

</s:SciChartSurface>
