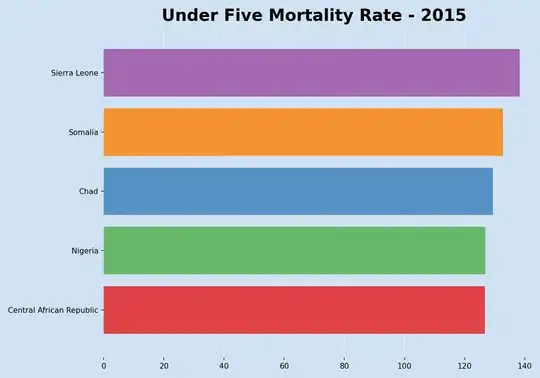
I'm a noob when it comes to Matplotlib and visualization in general. I've been following this tutorial: https://thecleverprogrammer.com/2020/06/23/bar-chart-race-tutorial-in-python-with-matplotlib/
Which provides a good base for solving my problems my only issue is the transitions are very abrupt - how would I go about adding smooth transitions like this - this is an example of how the transitions should look don't mind the actual data:

As far as I'm aware - the animation function produces a frame for every interval - how can I get frames where the bars are animating over each other?
Edit:
Here's the code I'm looking at
import pandas as pd
import matplotlib.pyplot as plt
import matplotlib.ticker as ticker
import matplotlib.animation as animation
from matplotlib.offsetbox import OffsetImage, AnnotationBbox
from moviepy.editor import VideoClip
from moviepy.video.io.bindings import mplfig_to_npimage

url = 'https://gist.githubusercontent.com/johnburnmurdoch/4199dbe55095c3e13de8d5b2e5e5307a/raw/fa018b25c24b7b5f47fd0568937ff6c04e384786/city_populations'

df = pd.read_csv(url, usecols=['name', 'group', 'year', 'value'])
df.head(3)

colors = dict(zip(
    ["India", "Europe", "Asia", "Latin America", "Middle East", "North America", "Africa"],
    ["#adb0ff", "#ffb3ff", "#90d595", "#e48381", "#aafbff", "#f7bb5f", "#eafb50"]
))
group_lk = df.set_index('name')['group'].to_dict()

fig, ax = plt.subplots(figsize=(15, 8))


def draw_barchart(current_year):
    dff = df[df['year'].eq(current_year)].sort_values(by='value', ascending=True).tail(10)
    ax.clear()
    ax.barh(dff['name'], dff['value'], color=[colors[group_lk[x]] for x in dff['name']])
    dx = dff['value'].max() / 200
    for i, (value, name) in enumerate(zip(dff['value'], dff['name'])):
        ax.text(value-dx, i,     "   {} ({})".format(name,round(value, 2)),           size=12, color='#777777' ,weight=600, ha='left', va='center')

    ax.text(1, 0.4, current_year, transform=ax.transAxes, color='#777777', size=46, ha='right', weight=800)
    #ax.text(0, 1.06, 'Population (thousands)', transform=ax.transAxes, size=12, color='#777777')
    ax.xaxis.set_major_formatter(ticker.StrMethodFormatter('{x:,.0f}'))
    ax.xaxis.set_ticks_position('bottom')
    ax.tick_params(axis='x', colors='#777777', labelsize=12)
    ax.set_yticks([])
    ax.margins(0, 0.01)
    ax.grid(which='major', axis='x', linestyle='-')
    ax.set_axisbelow(True)
    ax.text(0, 1.15, 'This is a title',
            transform=ax.transAxes, size=24, weight=600, ha='left', va='top', color="#777")
    ax.text(1, 0, "My description here", transform=ax.transAxes, color='#777777', ha='right',
            bbox=dict(facecolor='white', alpha=0.8, edgecolor='white'))
    plt.box(False)
    plt.subplots_adjust(left=0.15, right=0.80, bottom=0.20, top=0.86)


fig, ax = plt.subplots(figsize=(15, 8))
plt.show()
animator = animation.FuncAnimation(fig, draw_barchart, frames=range(1900, 2019))
animator.save('linex.gif', dpi=180, writer='imagemagick')
