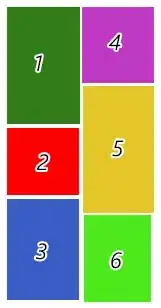
I have to create process diagramms multiple times a week. I looked into graphviz to make the process less cumbersome. I just started out learning it and it is truly great. However, I cannot figure out how to use subplots to create the layout I want.
- I want one "lane"/"row" with the process diagram
- I want one "lane"/"row" with notes that show, how the step is annoying at the moment
- I want one "lane"/"row" with general information about the process
I tried fiddling around with subgraphs, but that did not work. Is there some way I can achieve this? Here is the code for an example. I also added a picture to illustrate what I want to achieve:

digraph{
graph[rankdir =LR]

// the steps
subgraph steps{
node[shape = box]
S_1[label="Step 1"];
S_2[label = "Step 2"];
S_3[label = "Step ..."];
S_4[label = "Step k"]


S_1 -> S_2 -> S_3 -> S_4;
}

// the problems
subgraph problem {
node[shape = box, color = "red",fontsize = 8]
S_1p[label= "This is not working\nat all. People simply skip this\nstep."]
S_3p[label  = "Instead of changing\nthe session setting,\nusers simply call colleagues via phone"]

S_1p->S_1 //argh
S_3p -> S_3 //argh
}


//the notes
subgraph notes{
 node[shape = plaintext, color = "black",fontsize = 8]

 S_1n[label="This is really important additional information"]
 S_3n[label="This one as well"]

 S_1n -> S_1;
 S_3n -> S_3;
}
}
