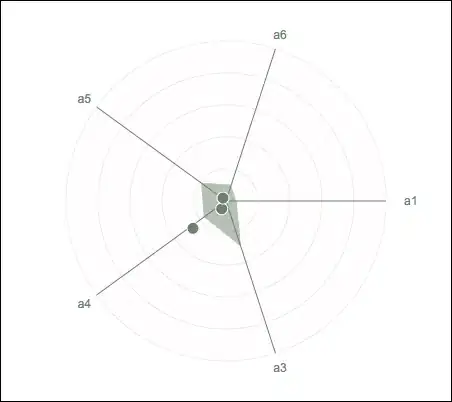
How can I add some padding between the various point groups (so that they are not all staying in the same vertical line)? To separate the point more like this other plot (figure 2). (The geom_jitter is not the solution, as it spreads the points all over)
Is there anything similar to position_dodge2() option?
Here I provide a test dataset
dataset <- data.frame(drug = rep(c("drug 1", "drug 2", "drug 3", "drug 4", "drug 5"), 20),
                      mouse =rep(paste0("test", 1:2), 50),
                      color = rep(c("color1", "color2", "color3", "color4"), 25),
                      amount_color = runif(100, 1, 2)
)


dataset %>%
  ggplot(aes(x = drug, y = amount_color, col = mouse)) +
  stat_sum() +
  theme_light() +
  theme(axis.text.x = element_text(angle = 45, hjust=1)) +
  stat_summary(fun="mean", geom="segment", mapping=aes(xend=..x.. - 0.5, yend=..y..), size = 1.5) +
  stat_summary(fun="mean", geom="segment", mapping=aes(xend=..x.. + 0.5, yend=..y..), size = 1.5)
Thank you very much.


