1

Suppose I have a data set with class variable with 4 levels: A, B, C and D. If I want to creater four series plots in SAS Studio I can run the following code using proc sgpanel.

proc sgpanel data = name;
panelby class;
series X = var1 Y = var2 / group = some_factor;
run;

How can modify this code to instead create 2 panels where the first panel has the graphs of both A and B and the second C and D? A naive solution would be to add a "dummy" 0-1 variable to the data set and using panelby dummy. However I was hoping for a more elegant solution!

Edit: To clarify I want to have different graphs for A and B in the same panel, not combine data into one graph.
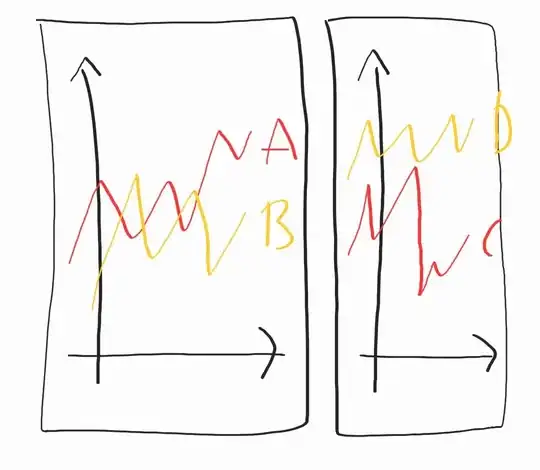
Graphs from the question

Joe
  • 62,789
  • 6
  • 49
  • 67
Jacobiman
  • 155
  • 5
  • Will you use GROUP= on the series statement? Will need a new variable for GROUP? – data _null_ Sep 13 '21 at 22:23
  • Yes I will use the group statement. Let me add that to the code – Jacobiman Sep 13 '21 at 22:25
  • Can you show an example using the `dummy` what the resulting sgpanel would be like? Preferably providing some data, or using `sashelp.class` or `sashelp.prdsale` or similar to get runnable code. – Joe Sep 13 '21 at 22:35

1 Answers1

0

If you're aiming to combine the A/B and C/D into one series each, then this is straightforward.

Using this sashelp.class example as the base:

proc sgpanel data=sashelp.class;
panelby age;
series x=height y=weight;
run;

We create a format that combines the class values in whatever fashion is preferred:

proc format;
  value agegroupf
  11-13="Younger"
  14-16="Older"
  ;
quit;

Then apply the format.

proc sgpanel data=sashelp.class;
format age agegroupf.;
panelby age;
series x=height y=weight;
run;

This won't show separate plots for the individual class values on the panel; if that's desired, then group could be used with a second class variable (an identical, but second, variable). However, if group is already being used, as in the updated question, it might be complicated to implement this. Separate series statements could be used to show each, but this is perhaps additionally complex.

Here's one way to do the overlaid groups - just copying age to age2.

data class;
  set sashelp.class;
  age2 = age;
run;

proc sgpanel data=class;
format age agegroupf.;
panelby age;
series x=height y=weight/group=age2;
run;

I think that in GTL you might be able to do it without actually creating a second variable, but I don't think it's possible in regular SGPanel.

Joe
  • 62,789
  • 6
  • 49
  • 67
  • Sorry, this not what I want. I want to have the series of A and the series of B to be two distinct graphs in the same window/panel. I am not looking to pool the observations themselves – Jacobiman Sep 13 '21 at 22:34
  • When you same in the same panel, do you mean overlapping (so, one single axis pair), or do you mean you want still 4 graphs, but "paired" in one column A/B with two pairs of axes, and in one column C/D with two pairs of axes? – Joe Sep 13 '21 at 22:35