I am attempting to make a log-lin plot where my y-axis has negative values. I also want to fit a best-fit line to it.
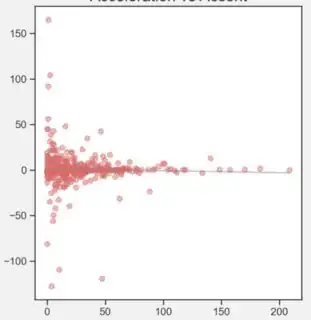
Here's the lin-lin plot:
Here's the plot with the (wrong) code:
plt.scatter(x, y, c='indianred', alpha=0.5)
z = np.polyfit(x, y, 1)
p = np.poly1d(z)
plt.plot(x,p(x),"-", color="grey", alpha=0.5)

plt.yscale('log')
plt.show()
Even tho the line for the plot is wrong, it plots the y-axis as I want it (I believe). However, if I comment plt.plot(x,p(x),"-", color="grey", alpha=0.5), I get the following plot instead:
This is essentially the same I get when writing the code the proper way:
plt.scatter(x, y, c='indianred', alpha=0.5)
p = np.polyfit(x, np.log(y), 1)
plt.semilogy(x, np.exp(p[0] * x + p[1]), 'g--')
plt.yscale('log')
plt.show()
but I obviously get the following error due to my negative y-values:
RuntimeWarning: invalid value encountered in log
  result = getattr(ufunc, method)(*inputs, **kwargs)
What alternative do I have so my y-values can be better seen? A best-fit line is not a must. I just want to better observe the relationship between these variables (which should be correlated theoretically).


