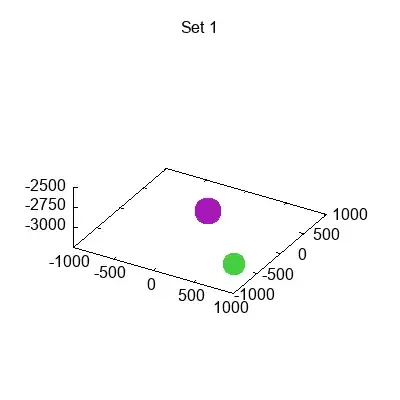
I would like to make a gif from a file data.dat:
   #x                     y                  z                   radius              color
#set 1
   222.333710          505.354645         -2938.58545          10.0000000          1.00000000
   854.180481          64.3471069         -2844.13477          12.5992117          53.0000000
  -109.606003          173.377197         -2975.83960          17.0997639          55.0000000

#set 2
  0.746170461        -0.868437707         -2876.14355          123.856239          2001.00000

#set 3
   1.56590324E-02      6.23370660E-03     -2870.87378          129.126297          4001.00000
At each time step I would like to plot:
splot "data.dat" using 1:2:3:4:5 with circles lc var notitle
for each set. Meaning at time 1 to plot the set 1, at time 2 the set 2 and so on.
The question of how to plot until a defined line has already been asked here. But how is it possible to plot until a line one doesn't know ? My idea is to code to plot until a blank line, but I'm open to any suggestion.
Eventually, in order to create the .gif I would write :
reset session

set term gif size 700,700 animate delay 30 optimize
set output "data.gif"

set xrange [-1000:1000]
set yrange [-1000:1000]
set zrange [-3000:-2500]

do for [a=1:3:1] {

###### code for splot

}
set output
