0

I am creating an app in ShinyDashboard and I am using pickerInput in order to have the possibility to select which columns do I want to use.

When I am selecting all the columns (or at least, more than 2) the output table looks well.

image 1

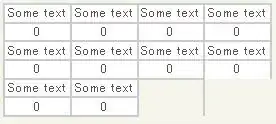
However, If I select only two columns the columns are displaced. It looks like this:

image 2

Do you know what it is going on? Do you know how to solve it?

Here you have the code:

library(shiny)
library(shinydashboard)
library(magrittr)
library(DT)
library(shinyWidgets)
library(dplyr)

ui <- dashboardPage(
  
  dashboardHeader(title = "Basic dashboard"),
  ## Sidebar content
  dashboardSidebar(
    sidebarMenu(
      menuItem("Table", tabName = "Table", icon = icon("th"))
    )
  ),
  
  dashboardBody(
    fluidRow(
    tabItems(
      
      tabItem(tabName = "Table",
              sidebarPanel(
                
                uiOutput("picker"),
                
                checkboxInput("play", strong("I want to play with my data"), value = FALSE),
                
                conditionalPanel(
                  condition = "input.play == 1",
                  checkboxInput("change_log2", "Log2 transformation", value = FALSE),
                  checkboxInput("run_sqrt", "sqrt option", value = FALSE)),
                
                actionButton("view", "View Selection")
                
              ),
              
              # Show a plot of the generated distribution
              mainPanel(
                dataTableOutput("table")
                
              )
      )
    )
  )
  )
)

server <- function(input, output, session) {
  
  data <- reactive({
    mtcars
  })
  
  data1 <- reactive({
    
    dat <- data()
    
    if(input$change_log2){
      dat <- log2(dat)
    }
    
    if(input$run_sqrt){
      dat <- sqrt(dat)
    }
    
    dat
  })
  
  # This is going to select the columns of the table
  output$picker <- renderUI({
    pickerInput(inputId = 'pick',
                label = 'Select columns to display',
                choices = colnames(data()),
                options = list(`actions-box` = TRUE),multiple = T,
                selected = colnames(data()))
  })
  
  #This function will save the "new" table with the selected columns.
  selected_columns <- eventReactive(input$view,{
    selected_columns <- data1() %>%
      select(input$pick)
    return(selected_columns)
    
  })
  
  output$table <- renderDataTable({
    
    datatable(
      selected_columns(),
      filter = list(position = 'top', clear = FALSE),
      selection = "none",
      rownames = FALSE,
      extensions = 'Buttons',
      
      options = list(
        scrollX = TRUE,
        autoWidth = TRUE,
        dom = 'Blrtip',
        buttons =
          list('copy', 'print', list(
            extend = 'collection',
            buttons = list(
              list(extend = 'csv', filename = "Counts", title = NULL),
              list(extend = 'excel', filename = "Counts", title = NULL)),
            text = 'Download'
          )),
        lengthMenu = list(c(10, 30, 50, -1),
                          c('10', '30', '50', 'All'))
      ),
      class = "display"
    )
    
    
  },rownames=FALSE)
  
}

shinyApp(ui, server)

Thanks very much in advance,

Regards
emr2
  • 1,436
  • 7
  • 23

1 Answers1

1

One way is to use fluidRow(column(align = "center",...)).

ui <- dashboardPage(

  dashboardHeader(title = "Basic dashboard"),
  ## Sidebar content
  dashboardSidebar(
    sidebarMenu(
      menuItem("Table", tabName = "Table", icon = icon("th")),
      uiOutput("picker"),
      
      checkboxInput("play", strong("I want to play with my data"), value = FALSE),
      
      conditionalPanel(
        condition = "input.play == 1",
        checkboxInput("change_log2", "Log2 transformation", value = FALSE),
        checkboxInput("run_sqrt", "sqrt option", value = FALSE)),
      
      actionButton("view", "View Selection")
    )
  ),

  dashboardBody(
    fluidRow(
      tabItems(

        tabItem(tabName = "Table",
                # Show a plot of the generated distribution
                fluidRow(column(align = "center", width=12, DTOutput("table")))
                
        )
      )
    )
  )
)

server <- function(input, output, session) {

  data <- reactive({
    mtcars
  })

  data1 <- reactive({

    dat <- data()

    if(input$change_log2){
      dat <- log2(dat)
    }

    if(input$run_sqrt){
      dat <- sqrt(dat)
    }

    dat
  })

  # This is going to select the columns of the table
  output$picker <- renderUI({
    pickerInput(inputId = 'pick',
                label = 'Select columns to display',
                choices = colnames(data()),
                options = list(`actions-box` = TRUE),multiple = T,
                selected = colnames(data()))
  })

  #This function will save the "new" table with the selected columns.
  selected_columns <- eventReactive(input$view,{
    selected_columns <- data1() %>%
      select(input$pick)
    return(selected_columns)

  })

  output$table <- renderDT({

    datatable(
      selected_columns(),
      filter = list(position = 'top', clear = FALSE),
      selection = "none",
      rownames = FALSE,
      extensions = 'Buttons',

      options = list(
        scrollX = TRUE,
        autoWidth = TRUE,
        dom = 'Blrtip',
        buttons =
          list('copy', 'print', list(
            extend = 'collection',
            buttons = list(
              list(extend = 'csv', filename = "Counts", title = NULL),
              list(extend = 'excel', filename = "Counts", title = NULL)),
            text = 'Download'
          )),
        lengthMenu = list(c(10, 30, 50, -1),
                          c('10', '30', '50', 'All'))
      ),
      class = "display"
    )


  },rownames=FALSE)

}

shinyApp(ui, server)

output

YBS
  • 19,324
  • 2
  • 9
  • 27
  • Thanks for your help, however... when you select all the columns, the table looks so small. Is there a way to put it justified (like in a text document) instead of center it? – emr2 Aug 18 '21 at 10:08
  • 1
    That is due to sidebarpanel being defined inside dashboardbody. Increasing the width to 12 and defining all sidebarpanel info in the dashboardsidebar, it looks fine to me. Please try the updated code. – YBS Aug 18 '21 at 13:45
  • Sorry I didn't see the width parameter! So as I need the sidebarpanel, I think it is better for me to increase the width to 12. Thanks very much for your help! – emr2 Aug 18 '21 at 14:30