2

I have a circle and simple function Math.cos(x)

I want the circle to be filled when it intersects with that function (fill only the upper side). But it's not working.

Script:

    // circle
    var point1 = app.board.create('point', [0,0], {size: 2, strokeWidth:2 })
    var point2 = app.board.create('point', [6,0], {size: 2, strokeWidth:2 })
    var circle = app.board.create('circle', [point1,point2], {strokeColor: "#f00", strokeWidth: 2 })
    
    // function
    var func = app.board.create('functiongraph',[function(x){ return Math.cos(x)}]);

    // intersection
    var curve = app.board.create('curve', [[], []], {strokeWidth: 0, fillColor: "#09f", fillOpacity: 0.8})
    curve.updateDataArray = function() {
        var a = JXG.Math.Clip.intersection(circle, func, this.board);
        this.dataX = a[0];
        this.dataY = a[1]
    };
    app.board.update()

Output

Output

Expected output (I did it on Paint)

Expected

Thank you in advance :)

Porizm
  • 531
  • 4
  • 16

2 Answers2

2

In the next example I'm building the d attribute for the path using Math.cos(). I suppose your function may be different. Please observe that at the end at the d attribute the path is closing the upper part of the svg canvas. I'm using the pth inside a clipPath and I'm clipping the circle with it.

let d ="M";

for(let x = -50; x<=50; x+=1){
  d+=`${x}, ${5*Math.cos(x/5)} `
}
d+="L50,-50L-50,-50z"
pth.setAttribute("d",d);
<svg viewBox="-50 -50 100 100" width="200">
  <clipPath id="clip">
    <path id="pth"/>
  </clipPath>
  <circle r="45" clip-path="url(#clip)" fill="blue"/>
</svg>

In order to better understand how I'm building the path please take a look at the next example:

let d ="M";

for(let x = -50; x<=50; x+=1){
  d+=`${x}, ${5*Math.cos(x/5)} `
}
d+="L50,-50L-50,-50z"
pth.setAttribute("d",d);
<svg viewBox="-50 -50 100 100" width="200">
  <circle r="45" fill="blue"/>
  <path id="pth" fill="rgba(250,0,0,.4)"/> 
</svg>
enxaneta
  • 31,608
  • 5
  • 29
  • 42
  • Hello @enxaneta, thank you for your solution. I actually need the solution to be with JSXGraph. That math library uses svg but sadly they don't allow me to edit svg tags like in your solution. – Porizm Aug 04 '21 at 18:26
  • The main idea is closing the path as I'm doing here: d+="L50,-50L-50,-50z" I suppose you'll have to change the function you are using – enxaneta Aug 04 '21 at 18:36
2

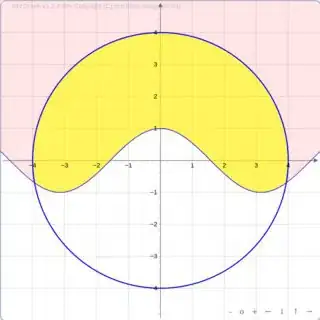
This can easily realized with the next version of JSXGraph which will be released next week: With the inequality element the area above the cosine curve can be marked. The inequality element is a closed curve and can be intersected with a circle. In v1.2.3, the intersection does not work because of a small bug.

For the clipping, the next version contains new elements curveintersection, curveunion, curvedifference which make it easier to use the methods of JXG.Math.Clip, but of course your approach with JXG.Math.Clip will still work.

Here is the code:

var f = board.create('functiongraph', ['cos(x)']);
var ineq = board.create('inequality', [f], {
            inverse: true, fillOpacity: 0.1
        });
var circ = board.create('circle', [[0,0], 4]);

var clip = board.create('curveintersection', [ineq, circ], {
            fillColor: 'yellow', fillOpacity: 0.6
        });

Intersecting inequality and circle

Actually, the inequality element does the same as enxaneta does "by hand".

Alfred Wassermann
  • 2,248
  • 1
  • 11
  • 10
  • Hello @Alfred Wassermann, I just tested the new version 1.3.0 and it's working exactly like i want. thank you so much for your great effort ;) – Porizm Aug 13 '21 at 17:24