I have a numerical dependent varible Y and one categorical independent variable X with 3 levels (x1, x2 and x3).
Y corresponds to the measurement of a sensor and X to three measurement conditions. Let's say I measured luminance of (Y) under 3 different conditions (X: x1, x2 and x3).
I'm using the statsmodels python library to perform a regression (how measurement conditions affect luminance)
res = smf.ols(formula='Y ~ C(X)', data=df_cont).fit()
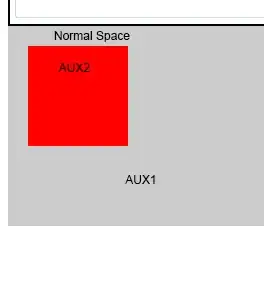
Now I need to plot the regression results (linear fit) and the "raw" data on the same plot. The plot I have in mind is something like this mock example:
[
I've tried the statsmodels plot_fit and albine_plot but have not managed to make it work. I've tried to follow this question but I'm still not able to do it.
Any idea on how to accomplish this would be very welcome!

