I have Data Frame like below:
import io
import matplotlib.pyplot as plt

df = pd.read_csv(io.StringIO("""target   |product
1        |EHZ
1        |GBK
0        |EHZ
0        |AKP
1        |AKP"""), sep="\s+\|", engine="python")
And I need to present above data on the percentage stacked plot like below:
To do it I try to use below code:
fig, ax = plt.subplots(figsize=(10,3))

# prepare dataframe for plotting
dfp = pd.crosstab(index=df["product"], columns=df["target"]).apply(lambda r: r/r.sum(), axis=1)
# simple stacked plot
ax = dfp.plot(kind="barh", stacked=True, ax=ax)

for c in ax.containers:
    # customize the label to account for cases when there might not be a bar section
    labels = [f'{w*100:.0f}%' if (w := v.get_width()) > 0 else '' for v in c ]

    # set the bar label
    ax.bar_label(c, labels=labels, label_type='center')

ax.set_xlabel("procent")
ax.set_title("tytul")
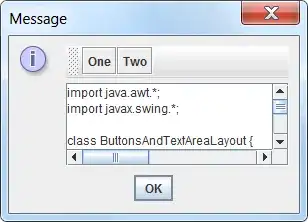
But I have Syntax error like below:
Could you help me to rewrite this code to Python version 3.7.4 ? Because this syntax error is caused by version of Python (code above is only fo Python 3.8 or higher) or to find other solution (other code) how to create plot like on the picture above in Python ?
Thank you very much!

