I'm trying to plot some 3D shapes in Python Plotly. For the sake of practicing, I was trying to plot a cube.
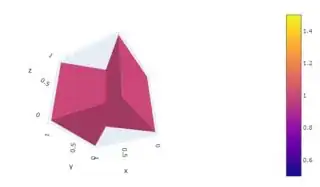
I tried the Isosurface command since I'm only interested in the outside of the shape, but surprisingly enough, the output was not a cube.
import plotly.graph_objects as go
import numpy as np

x=[0, 0, 1, 1, 0, 0, 1, 1]
y=[0, 1, 1, 0, 0, 1, 1, 0]
z=[0, 0, 0, 0, 1, 1, 1, 1]

myisosurf = go.Isosurface(x=x,y=y,z=z,value= np.ones(len(x)))
fig = go.Figure(data=myisosurf)
fig.show()
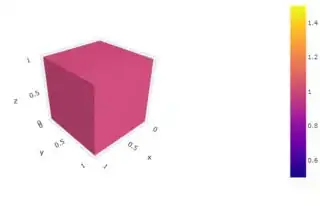
I did get it to work with the Mesh3D command (with a little help from here), but the fact that it also requires settings for parameters of i, j, k, makes me prefer a more straightforward method. Especially when working with more complex shapes than a cube, it would be very hard to set the i, j, k parameters.
i= [7, 0, 0, 0, 4, 4, 6, 1, 4, 0, 3, 6]
j= [3, 4, 1, 2, 5, 6, 5, 2, 0, 1, 6, 3]
k= [0, 7, 2, 3, 6, 7, 1, 6, 5, 5, 7, 2]

my3dmesh = go.Mesh3d(x=x,y=y,z=z, i=i, j=j, k=k, intensity = np.linspace(1, 1, 8, endpoint=True),name='y')
fig = go.Figure(data=my3dmesh)
fig.show()
How can I get Python Plotly to show the outside of a shape without manually defining its faces through i,j,k parameters?


