0

I have:

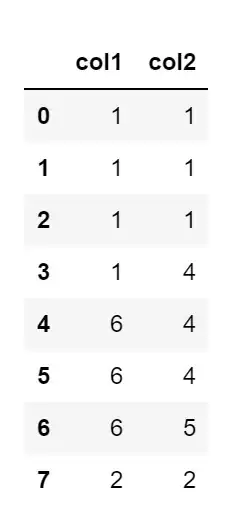
df=pd.DataFrame({'col1':[1,1,1,1,6,6,6,2],'col2':[1,1,1,4,4,4,5,2]})

enter image description here

I want:

to group by each value in col1 and then show the tabulated frequencies in the second column (ie, there are 3 1s and 1 4 in group 1 shown as 1:3, 4:1, ie value:frequency).

I would also like to have the list sorted in descending order based on count
enter image description here

frank
  • 3,036
  • 7
  • 33
  • 65

1 Answers1

0

Not sure if this the most efficient answer, but the solution I found was:

gpby = df.groupby('col1')
vals = []
for i, row in gpby:
    v = row.col1.values[0]
    c = row.shape[0]
    vc=row.col2.value_counts().reset_index().values.tolist()
    row_values = (v,c,vc)
    vals.append(row_values)
    
new_df = pd.DataFrame(vals, columns=['value','cnt','vc'])
new_df

enter image description here

frank
  • 3,036
  • 7
  • 33
  • 65