I am trying to animate multiple lines at once in matplotlib. To do this I am following the tutorial from the matplotlib.animation docs:
https://matplotlib.org/stable/api/animation_api.html
The idea in this tutorial is to create a line ln, = plt.plot([], []) and update the data of the line using ln.set_data in order to produce the animation. Whilst this all works fine when the line data is a 1 dimensional array (shape = (n,)) of n data points, I am having trouble when the line data is a 2 dimensional array (shape = (n,k)) of k lines to plot.
To be more precise, plt.plot accepts arrays as inputs, with each column corresponding to a new line to plot. Here is a simple example with 3 lines plotted with a single plt.plot call:
import matplotlib.pyplot as plt
import numpy as np


x = np.linspace(0, 2 * np.pi, 100).reshape(-1, 1)
x = np.concatenate([x] * 3, axis=1)

# generate 3 curves
y = np.copy(x)
y[:, 0] = np.cos(y[:, 0])
y[:, 1] = np.sin(y[:, 1] )
y[:, 2] = np.sin(y[:, 2] ) + np.cos(y[:, 2])

fig, ax = plt.subplots()
plt.plot(x,y)
plt.show()
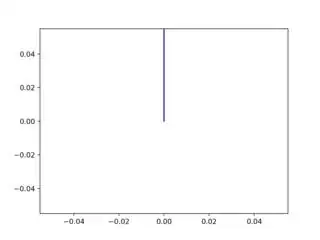
However if I try to set the data using .set_data as required for generating animations I have a problem:
import matplotlib.pyplot as plt
import numpy as np


x = np.linspace(0, 2 * np.pi, 100).reshape(-1, 1)
x = np.concatenate([x] * 3, axis=1)

# generate 3 curves
y = np.copy(x)
y[:, 0] = np.cos(y[:, 0])
y[:, 1] = np.sin(y[:, 1] )
y[:, 2] = np.sin(y[:, 2] ) + np.cos(y[:, 2])

fig, ax = plt.subplots()
p, = plt.plot([], [], color='b')
p.set_data(x, y)
plt.show()
Is there a way to set_data for 2 dimensional arrays? Whilst I am aware that I could just create three plots p1, p2, p3 and call set_data on each of them in a loop, my real data consists of 1000-10,000 lines to plot, and this makes the animation too slow.
Many thanks for any help.


