I have very limited experience coding so please bear with me!
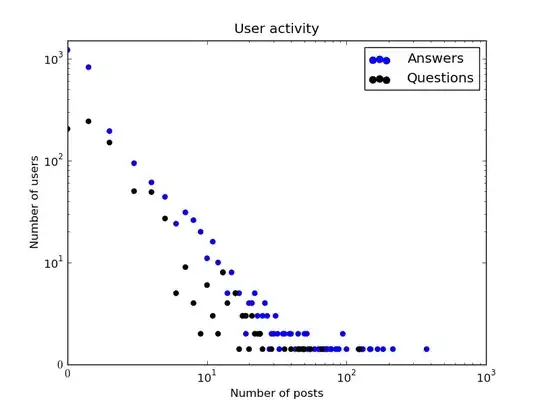
I have a newick tree and a .txt file with various cell numbers assigned to various clone numbers, shown here:

I've followed the steps from the PHE: Bioinformatics page and all I am getting is one color on all of the tips, not seeming to categorize the cells by Clone number.
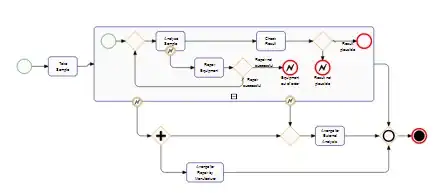
Here is an image of the resulting plot:

library("ggplot2")
library("ggtree")
nwk <- ("/Users/Nisu/Downloads/True.nwk")
tree <- read.tree(nwk)
p <- ggtree(tree,right = TRUE)
tip_metadata <- read.table("/Users/Nisu/Downloads/TallG5clone_50_9_True_cloneAnno.txt", sep="\t",col.names = c("Clone", "Cell"),header=TRUE,check.names=FALSE, stringsAsFactor=F)
p <- p %<+% tip_metadata + geom_tippoint(aes(color= "Clone"), size=3)
plot(p)

