1

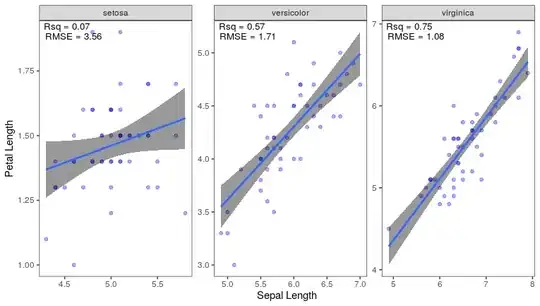
I am trying to automatically position R2 and RMSE in facetted ggplot. This answer has helped me to put the R2 and RMSE in facetted ggplot manually using the following code

library(caret)
library(tidyverse)

summ <- iris %>% 
  group_by(Species) %>% 
  summarise(Rsq = R2(Sepal.Length, Petal.Length),
            RMSE = RMSE(Sepal.Length, Petal.Length)) %>% 
  mutate_if(is.numeric, round, digits=2)

p <- ggplot(data=iris, aes(x = Sepal.Length, y = Petal.Length)) +
  geom_point(color="blue",alpha = 1/3) + 
  facet_wrap(Species ~ ., scales="free") +
  geom_smooth(method=lm, fill="black", formula = y ~ x) +
  xlab("Sepal Length") +
  ylab("Petal Length") + theme_bw() +
  theme(panel.grid.major = element_blank(), panel.grid.minor = element_blank()) 

# Here we create our annotations data frame.
df.annotations <- data.frame()
# Rsq
df.annotations <- rbind(df.annotations,
                        cbind(as.character(summ$Species),
                              paste("Rsq", summ$Rsq,
                                    sep = " = ")))

# RMSE
df.annotations <- rbind(df.annotations,
                        cbind(as.character(summ$Species),
                              paste("RMSE", summ$RMSE,
                                    sep = " = ")))

# This here is important, especially naming the first column
# Species
colnames(df.annotations) <- c("Species", "label")

df.annotations$x <- rep.int(c(4.5, 5.5, 5.5), times = 2)
df.annotations$y <- c(1.75, 5.0, 6.8,
                      1.7, 4.9, 6.7)


p + geom_text(data = df.annotations,
              mapping = aes(x = x, y = y, label = label))

enter image description here

As you can see from df.annotations, I am providing the positions manually. Now how can I automatically position R2 and RMSE in ggplot2?

UseR10085
  • 7,120
  • 3
  • 24
  • 54

2 Answers2

1

This isn't quite what you're looking for, but you could move the Rsq & RMSE in to the facet titles e.g.

# copy species, and change its values to include the Rsq and RMSE. Levels should match if both grouped alphabetically
iris$Species2 <- iris$Species
levels(iris$Species2) <- sprintf("%s \n Rsq=%s \n RMSE=%s",
                                levels(iris$Species), summ$Rsq, summ$RMSE)

# change facet wrap to Species2
p <- ggplot(data=iris, aes(x = Sepal.Length, y = Petal.Length)) +
  geom_point(color="blue",alpha = 1/3) + 
  facet_wrap(~Species2, scales="free") +
  geom_smooth(method=lm, fill="black", formula = y ~ x) +
  xlab("Sepal Length") +
  ylab("Petal Length") + theme_bw() +
  theme(panel.grid.major = element_blank(), panel.grid.minor = element_blank()) 
p
Jonny Phelps
  • 2,687
  • 1
  • 11
  • 20
  • No, I don't want to move the Rsq & RMSE into the facet titles. I have shown the expected output in my question. – UseR10085 Jun 02 '21 at 09:23
  • No worries. I didn't offhand have a solution for that but knew an alternative route so thought I'd share in case it also solved your problem :) – Jonny Phelps Jun 02 '21 at 11:46
1

Basically we set x and y to -Inf and +Inf in geom_text() then tweak the position with hjust and vjust. As we have two rows: Rsq... and RMSE we define vertical_adjustement before geom_text()

The whole code:

library(caret)
library(tidyverse)

summ <- iris %>% 
  group_by(Species) %>% 
  summarise(Rsq = R2(Sepal.Length, Petal.Length),
            RMSE = RMSE(Sepal.Length, Petal.Length)) %>% 
  mutate_if(is.numeric, round, digits=2)

p <- ggplot(data=iris, aes(x = Sepal.Length, y = Petal.Length)) +
  geom_point(color="blue",alpha = 1/3) + 
  facet_wrap(Species ~ ., scales="free") +
  geom_smooth(method=lm, fill="black", formula = y ~ x) +
  xlab("Sepal Length") +
  ylab("Petal Length") + theme_bw() +
  theme(panel.grid.major = element_blank(), panel.grid.minor = element_blank()) 

# Here we create our annotations data frame.
df.annotations <- data.frame()
# Rsq
df.annotations <- rbind(df.annotations,
                        cbind(as.character(summ$Species),
                              paste("Rsq", summ$Rsq,
                                    sep = " = ")))

# RMSE
df.annotations <- rbind(df.annotations,
                        cbind(as.character(summ$Species),
                              paste("RMSE", summ$RMSE,
                                    sep = " = ")))

# This here is important, especially naming the first column
# Species
colnames(df.annotations) <- c("Species", "label")


vertical_adjustment = ifelse(grepl("Rsq",df.annotations$label),1.5,3)


p + geom_text(data=df.annotations,aes(x=-Inf,y=+Inf,label=label),
              hjust = -0.1, vjust = vertical_adjustment, size=3.5)

enter image description here

How to do:

Remove this part at the end:

df.annotations$x <- rep.int(c(4.5, 5.5, 5.5), times = 2)
df.annotations$y <- c(1.75, 5.0, 6.8,
                      1.7, 4.9, 6.7)


p + geom_text(data = df.annotations,
              mapping = aes(x = x, y = y, label = label))

replace by:

vertical_adjustment = ifelse(grepl("Rsq",df.annotations$label),1.5,3)


p + geom_text(data=df.annotations,aes(x=-Inf,y=+Inf,label=label),
              hjust = -0.1, vjust = vertical_adjustment, size=3.5)
TarJae
  • 72,363
  • 6
  • 19
  • 66
  • Thank you for your answer. It is just what I was wanted. Can you please explain what `ifelse(grepl("Rsq",df.annotations$label),1.5,3)` part is doing? Specially the values 1.5 and 3 is doing? – UseR10085 Jun 02 '21 at 09:27
  • with `grpl ` we check in label column if there is a string "Rsq" -> if true then put it on vertical position 1.5, else in this case RMSE on vertical position 3 – TarJae Jun 02 '21 at 09:29
  • Suppose I want to add another line i.e. Rsq, RMSE and NSE, then how this part `ifelse(grepl("Rsq",df.annotations$label),1.5,3)` should be changed? – UseR10085 Jun 02 '21 at 09:33
  • With `ifelse` you get only true and false to distinguish with more elements we should use `case_when`. This would imply that in your df.annotations$label column there are more then two possiblites. Maybe you can start a new question referring to this question and I can show! – TarJae Jun 02 '21 at 09:37
  • I have asked a [new question](https://stackoverflow.com/questions/67802720/how-to-automatically-position-multiple-model-evaluation-parameters-in-facetted-g). Kindly visit that. – UseR10085 Jun 02 '21 at 09:46