2

When I add static data to a chart created with TikZ and include_tikz() from R/exams, they are rendered correctly. For example I have created the following graphic

TikZ graphic

using exams::include_tikz(graf01, library = "arrows") with the TikZ code below. And then I can include it in exams2html(), exams2moodle(), etc.

 graf01<-c("\\definecolor{uuuuuu}{rgb}{0.26,0.26,0.26}",
      "\\definecolor{zzttqq}{rgb}{0.6,0.2,0}",
      "\\definecolor{ududff}{rgb}{0.30,0.30,1}",
      "\\begin{tikzpicture}[line cap=round,line join=round,>=triangle 45,x=1cm,y=1cm]",
      "\\clip(-0.1,-0.1) rectangle (5,5);",
      "\\fill[line width=2pt,color=zzttqq,fill=zzttqq,fill opacity=0.10] (0,0) -- (4.68,-0.02) -- (4.7,4.66) -- (0.02,4.68) -- cycle;",
      "\\draw (3.44,3.80) node[anchor=north west] {\\textbf{12}};",
      "\\draw (0.35,4.57) node[anchor=north west] {\\textbf{DH}};",
      "\\draw (3.97,4.57) node[anchor=north west] {\\textbf{CA}};",
      "\\draw (2.31,0.72) node[anchor=north west] {\\textbf{R}};",
      "\\draw [line width=2pt] (1.76,3.08) circle (1.3cm);",
      "\\draw [line width=2pt] (3.05,3.13) circle (1.3cm);",
      "\\draw [line width=2pt] (2.45,1.98) circle (1.3cm);",
      "\\draw [line width=2pt,color=zzttqq] (0,0)-- (4.68,-0.02);",
      "\\draw [line width=2pt,color=zzttqq] (4.68,-0.02)-- (4.7,4.66);",
      "\\draw [line width=2pt,color=zzttqq] (4.7,4.66)-- (0.02,4.68);",
      "\\draw [line width=2pt,color=zzttqq] (0.02,4.68)-- (0,0);",
      "\\begin{scriptsize}",
      "\\draw [fill=ududff] (0,0) circle (2.5pt);",
      "\\draw [fill=ududff] (4.68,-0.02) circle (2.5pt);",
      "\\draw [fill=uuuuuu] (4.7,4.66) circle (2.5pt);",
      "\\draw [fill=uuuuuu] (0.02,4.68) circle (2.5pt);",
      "\\end{scriptsize}",
      "\\end{tikzpicture}")

Now instead of hard-coding the number 12 in graf01[7]

"\\draw (3.44,3.80) node[anchor=north west] {\\textbf{12}};"

I want to use a randomly-generated number, say:

 vald <- sample(1:20, 1)

I tried using

"\\draw (3.44,3.80) node[anchor=north west] {\\textbf{vald}};"

but then the string vald instead of its value is included:

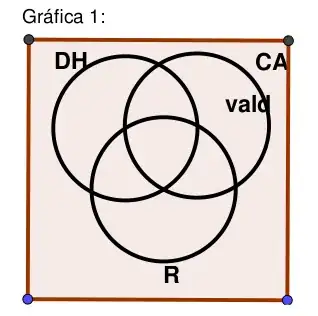
How can I include the value of vald instead?

Achim Zeileis
  • 15,710
  • 1
  • 39
  • 49
  • I assume that you are the same user as https://stackoverflow.com/users/15344973/%c3%81lvaro-%c3%81ngel-molina Why are you posting under different names/pseudonyms? It makes it more difficult to understand connections between questions... Also, do you happen to be the same user as https://stackoverflow.com/users/15677793/alvaretto-ancelotti ? If so, please follow up on the only question you asked under that pseudonym. – Achim Zeileis May 22 '21 at 03:41
  • Forgiveness. It's true. One of those pseudonyms I used once. I made many mistakes due to ignorance of the rules and decided to abandon it. The other pseudonym I used today because I had trouble asking the question. It will not happen again. Thanks. – El Diario de Alvaretto May 22 '21 at 03:52
  • If you still have the Ancelotti account please accept the answer to the num_to_schoice question so that it is flagged correspondingly on StackOverflow. Thanks. – Achim Zeileis May 22 '21 at 04:19
  • The email I used for that pseudonym, no longer exists ... – El Diario de Alvaretto May 22 '21 at 04:26

1 Answers1

0

To include the value of a variable in a string you can use the function paste() or paste0():

vald <- 7
line7 <- paste0("\\draw (3.44,3.80) node[anchor=north west] {\\textbf{", vald, "}};")
line7
## [1] "\\draw (3.44,3.80) node[anchor=north west] {\\textbf{7}};"

Or for equivalent output sprintf():

line7 <- sprintf("\\draw (3.44,3.80) node[anchor=north west] {\\textbf{%s}};", vald)

The latter is typically more convenient if you have several placeholders like %s in a string or when you have different types of placeholds etc.

In either case you can subsequently do:

graf01[7] <- line7
include_tikz(graf01, library = "arrows")
TikZ picture with modified line 7
Achim Zeileis
  • 15,710
  • 1
  • 39
  • 49
  • It worked perfectly. We keep moving forward. Thank you very much for your guidance. – El Diario de Alvaretto May 22 '21 at 06:02
  • For combining this with https://stackoverflow.com/questions/67630203/how-to-include-tikz-images-in-r-exams-exercises I would recommend the following: Set up one long character string `venn` with the **template** for the Venn diagram including `%s` placeholders in all positions that contain frequencies. Then generate the different frequency vectors and do `graf1 <- sprintf(venn, freq1[1], freq1[2], ...)` and `graf2 <- sprintf(venn, freq2[1], freq2[2], ...)` and so on. And then you can use `include_tikz(...)` for all of the different graphics and include them in the answerlist. Good luck! – Achim Zeileis May 22 '21 at 11:18
  • Thanks Achim for the good wishes. I do not fully understand this strategy that you have just proposed to me. One last question: Is there no way to randomize variables outside the chunks of `R`, that is, with the `TikZ` code, in the `Latex` environment? A million thanks. – El Diario de Alvaretto May 23 '21 at 23:34
  • 1
    It's surely easiser to do on the R side because you need the solution etc. in R as well. As for the proposed strategy. Say you have a general LaTeX template with `%s` placeholders such as `venn <- '\\textbf{%s} and \\textbf{%s}'`. And then you sample different frequencies like `freq1 <- sample(1:20, 2)` and `freq2 <- sample(1:20, 2)`. Then these can be combined as `graf1 <- sprintf(venn, freq1[1], freq1[2])` and `graf2 <- sprintf(venn, freq2[1], freq2[2])`. Of course, in your case the LaTeX code and the random sampling will be more complex but the basic strategy will remain the same. – Achim Zeileis May 24 '21 at 02:47
  • When I need `exams2pdf` I find it easier on the `Latex` side (not so much on the `R` side), because it is only "copy and paste" the code directly from `TikZ`, even requiring a random solution. Is it possible to generate the image (`TikZ`) for `exams2moodle` in this way? Thanks. – Álvaro Ángel Molina Jun 01 '21 at 02:10
  • No, unfortunately not. For inclusion in HTML you need to create a separate graphics file in one of the formats that can be directly embedded, e.g., PNG, JPG, or SVG. So you need a separate program to create/convert that figure. In exams2pdf this is not necessary because everything is compiled into a single PDF file controlled by LaTeX. – Achim Zeileis Jun 01 '21 at 17:18
  • I can't replicate your "long character string" strategy for `Venn`. I got lost. I do not know what I'm doing wrong. – Álvaro Ángel Molina Jun 02 '21 at 04:10
  • Can I elaborate a new question? I cannot convert other `TikZ` codes downloaded from the internet to a character string. – Álvaro Ángel Molina Jun 02 '21 at 04:12
  • Strategy 1: Copy the `{tikzpicture}` in your code editor and put it in single quotes `tikz <- '...'`. Then use find-&-replace for all `\ ` by `\\ `. Then use find-&-replace for all `'` by `\'` (without the closing `'` from the string). If the TikZ code contains many single quotes, you can apply the same strategy with double quotes. ~ Strategy 2: Use `tikz <- readLines("file.tex")` and then copy the output of `dput(tikz)` into the exercise. Typically, Strategy 1 should yield more readable code then Strategy 2, I would say. And as usual: Try to start simple and then get more complex gradually. – Achim Zeileis Jun 02 '21 at 06:26
  • Thanks!!! Thanks!!! Thanks!!! Thanks!!! Thanks!!! Thanks!!! Thanks!!! And finally, Thank you !!! – Álvaro Ángel Molina Jun 02 '21 at 23:05