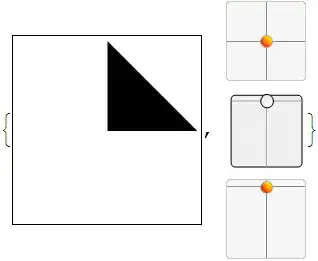
I'm trying to create a 1D scatter plot with Charts.js. This is the best I could do:
I like the visual effect of using "line" and rotating it 90 degrees. However, I wish the graph was smaller along the Y axis. I've already set display: false on the Y axis, and also limited its range from -0.1 to 0.1, so what more can I do?
