10

I am looking for a solution to avoid overlapping text in the text-labels. I create the image with plotly scatter. Maybe there is an automation here.

from pandas import util
import plotly.express as px
import plotly.graph_objects as go

df = util.testing.makeDataFrame()
df_keyfigures_all = df[['A','B']]


fig = px.scatter(df_keyfigures_all, x="A", y="B",size_max=60,
                     text=df_keyfigures_all.index)

fig.update_traces(textposition='top center')
fig.layout = go.Layout(yaxis=dict(tickformat=".0%"), xaxis=dict(tickformat=".0%"),
                       yaxis_title="A", xaxis_title="B")


fig.update_layout(showlegend=False)
plotly.io.write_image(fig, file='keyfigures.png', format='png')
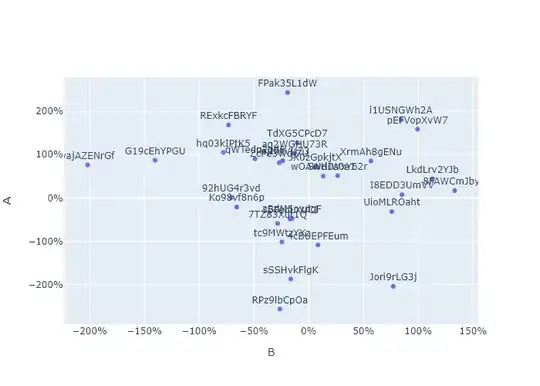
Points with overlapping labels

vvvvv
  • 25,404
  • 19
  • 49
  • 81
Alex
  • 999
  • 1
  • 14
  • 31

4 Answers4

9

One solution is to alternate the text position like in this live demo:

import pandas as pd
from plotly import express as px, graph_objects as go

df = pd.DataFrame()
df['x'] = [0, 1, 1, 2, 3, 6, 7, 7, 8, 8, 9, 9, 10, 11, 11, 12]
df['y'] = [57, 55, 75, 23, 80, 66, 66, 23, 79, 79, 20, 71, 59, 74, 82, 77]
df['explainer_name'] = ['tree_shap_approximation', 'saabas', 'tree_shap', 'baseline_random', 'archipelago',
                        'shapley_taylor_interaction', 'partition', 'anova', 'permutation_partition', 'permutation',
                        'shap_interaction', 'sage', 'maple', 'lime', 'kernel_shap', 'exact_shapley_values']

fig = px.scatter(df,
                     x='x',
                     y='y',
                     # size='dot_size',
                     text='explainer_name',
                     # log_x=True,
                     labels={
                         "x": "Time",
                         "y": "Score",
                         # 'dot_size': 'Portability',
                         'explainer_name': 'Explainer '
                     },
                     title='No overlapping annotations',  # take some vertical space
                     )
def improve_text_position(x):
    """ it is more efficient if the x values are sorted """
    # fix indentation 
    positions = ['top center', 'bottom center']  # you can add more: left center ...
    return [positions[i % len(positions)] for i in range(len(x))]

fig.update_traces(textposition=improve_text_position(df['x']))
fig.show()

Before: enter image description here

After: enter image description here

pakira79
  • 111
  • 2
  • 5
Karim-53
  • 135
  • 1
  • 5
7

Unfortunately, there does not seem to be a direct way to do this. A little digging on the plotly community forum will show you that it has already been requested and that the developers are aware of the issue.

vestland
  • 55,229
  • 37
  • 187
  • 305
2

I've been struggling with this one as well, especially because with longer text labels and 20-ish points, randomizing the positions doesn't work well enough. If I have 20 labels, and have 8 possible locations per label, randomizing gives 2^23 combinations, of which only a few may give no overlap at all.

What I ended up with is creating a graph with randomized first positions, and adding a click-event to cycle through positions for a single point. Then I generate the graph a few times to get a good random starting point, and manually optimize the locations of the points that still show overlap.

import pandas as pd
import plotly.graph_objects as go
from itertools import cycle

df = pd.DataFrame()

df['x'] = [1,2,3]
df['y'] = [1,2,3]

positions = ['top left', 'top center', 'top right', 'middle right', 'bottom right', 'bottom center', 'bottom left', 'middle left']
cycled_list = cycle(positions)

def update_point(trace, points, selector):
    p = list(scatter.textposition)  # get the current location assignments
    for i in points.point_inds:  # all selected point indeces
        p[i] = next(cycled_list)  # replace corresponding list item by new position
        with fig.batch_update():
            scatter.textposition = p
            
def random_text_position(x):
    positions = ['top left', 'top center', 'top right', 'middle left', 'middle right', 'bottom left', 'bottom center', 'bottom right']  # you can add more: left center ...
    return [random.choice(positions) for i in range(len(x))]

fig = go.FigureWidget()

fig.add_trace(go.Scatter(
    x=df['x'],
    y=df['y'],
    mode="markers+text",
    name="Markers and Text",
    text=df.index,
    textposition=random_text_position(df.index)
))

scatter = fig.data[0]

scatter.on_click(update_point)

fig
StephanT
  • 649
  • 5
  • 12
-1

It is not the perfect solution, but one way is to hide the text in the hover text.

fig = px.scatter(df_keyfigures_all, x="A", y="B",size_max=60,
                 hover_name = df_keyfigures_all.index)
bananaquit
  • 103
  • 6