Clarification: most of the pages will say Top10 ... Actually, the measure used was a simple Top5 that includes products with the same number of orders than the 5th product. Therefore, to avoid dealing with larger images, 7 products will be seen but it is a Top5 ranking. The idea is you can replace it with your custom TopN measure.
What I understood:
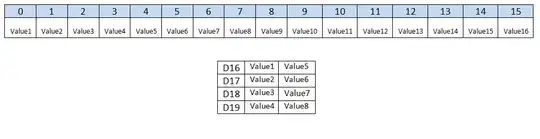
The simplification of your model plus the disconnected help table would be:

I have one visualization that displays the ten most frequently bought
products in a time frame that is set by a slicer.
The Date slicer belongs to the Dates table in the Data model.
The table viz represents the number of rows in the sales table in the
current context (for each product within the Date range).
The table viz is sorted according to the [#Rows] measure in descending
order.
The table viz only presents the TopN products even without the presence
of the [#Rows] measure due to the presence of the [TopOrders]
measure within Filters on this visual. [TopOrders] is 1.
On the second page you create:
- A slicer with the Dates[Date] column (the same one used on the
previous page).
- A matrix with Products[ProductName] on the rows, HDates[Year] on
the columns, and a measure on values.
From the View tab, you select the Sync Slicers option.
Inside the Sync Slicers pane:
- In the Sync column, check the boxes related to the necessary pages.
- In the Display column uncheck the box that contains the over
years report.
So far all we have done is pass the time frame context from page 1 to page 2.
Since the TopN context depends on the time frame context, we can now use the [TopOrders] measure as a Filters on this visual in the matrix. Again, [TopOrders] is 1.
Why do the numbers differ between rows and not between columns?
Also, in this example, the Sales table only has information up to 12/31/2020 but the visualization shows an additional year and the Sales[Amount] values for each order is $1 so that [#Orders] and [SalesAmount] are the same for easy comparison.
HDates is not related to the model and for each combination of HDates[Year]-Products[ProductName], the [SalesAmount] measure is using the information coming from the previously hidden slicer and the respective Products[ProductName] because the information coming from HDates[Year] has no effect yet.
In order to complete this exercise, it only remains to modify the [SalesAmount] measure in such a way that it removes the filter on the time frame (Dates[Date]) and it recognizes HDates[Year] as Dates[Year].
SalesAmount :=
CALCULATE(
    SUM(Sales[Amount]),
    ALL(Dates),
    TREATAS(VALUES(HDates[Year]),Dates[Year])
    )
And this is the final result.
I hope it works for someone or the idea can be improved.


