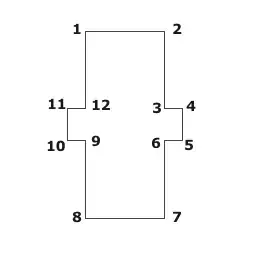
I would like to visualize a "linear" directed graph with the layout like that:
All the in- and out-degrees are 1 (except the first and last, of course). The length of the labels are different, so I can't calculate easily, how many nodes will fit in one row or the other. The code I have so far is this.
import networkx as nx
from networkx.drawing.nx_pydot import to_pydot

G = nx.DiGraph()
G.add_node("XYZ 1.0")
for i in range(1, 20):
    G.add_node(f'XYZ 1.{i}', style='filled', fillcolor='skyblue')
    G.add_edge(f'XYZ 1.{i-1}', f'XYZ 1.{i}')

# set defaults
G.graph['graph'] = {'rankdir': 'LR'}
G.graph['node'] = {'shape': 'rectangle'}
G.graph['edges'] = {'arrowsize': '4.0'}

pydt = to_pydot(G)
prog = 'dot'
file_name = f'nx_graph_{prog}.png'
pydt.write(file_name, prog=prog, format="png")
So far I use networkx in a project that needs to be run in a Python docker container, so I would like to use pydot and Networkx, if it is possible.
In some of the graphviz programs I can set coordinates if I understand correctly, but for setting coordinates I should know the widths of the boxes to avoid overlapping boxes.

