I have the following data frame; here a sample of it. One factor year, four integer variables ep1:ep4 and one weighting variable w.
I use R v.4.0.2 and Rstudio v.1.2.5042.
I want to have the weighted means calculated for each year separately and have the weighted mean and the associated 95% confidence interval displayed in a graph (point graph).
    ep1 <- as.integer(runif(50,1,5))
    ep2 <- as.integer(runif(50,1,5))
    ep3 <- as.integer(runif(50,1,5))
    ep4 <- as.integer(runif(50,1,5))

    y1 <- seq(from=1980, to=2020, by=2)
    y2 <- seq(from=1980, to=2020, by=2)
    y3 <- seq(from=1980, to=2020, by=2)

    w <- rnorm(50, 1, 1)

    year <- c(y1,y2,y3); year <- year[-51:-64]

    df <- data.frame(year, ep1, ep2,ep3, ep4, w)
    head(df)
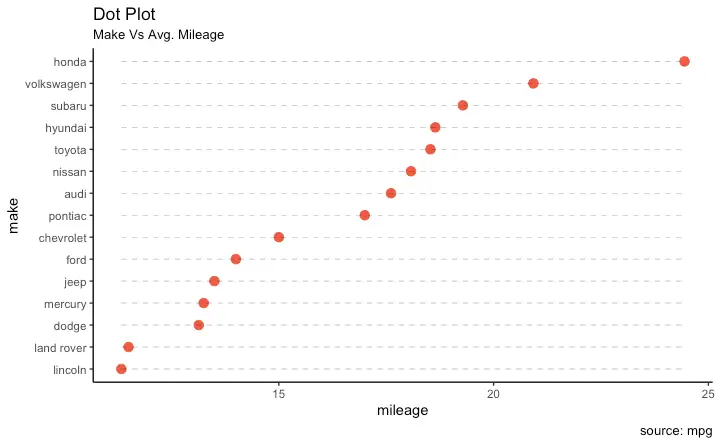
The graph should be something like this.
I managed to calculate the weighted mean using:
  dat <- df %>%
       group_by(year) %>%
       summarise_at(vars(ep1:ep4), list(~ weighted.mean(., w=w, na.rm=TRUE)))
This works fine when I create the plot using ggplot function from package ggplot2. I used the following:
   plot <- ggplot(dat, aes(year)) +
         geom_point(aes(y=ep1_weighted.mean), color="blue") +
         labs(title="My title", subtitle="My subtitle", x="X-axis title", y="Y-axis title")
Everything works just fine, but I just cannot figure out how to plot the 95% CI calculated for the weighted mean on the plot.
First, I tried getting the 95% CI (the lower and upper bounds) from the t.test function, but I couldn't figure how to calculate the t.test for the weighted data.
Second, I tried using the weights package to calculate the weighted t.test but I couldn't find the lower and upper bounds.
Thanks a lot for helping! (BTW: I am still a beginner in R)