MATLAB has a nice silhouette function to help evaluate the number of clusters for k-means. Is there an equivalent for Python's Numpy/Scipy as well?
Asked
Active
Viewed 5,093 times
3 Answers
16
I present below a sample silhouette implementation in both MATLAB and Python/Numpy (keep in mind that I am more fluent in MATLAB):
1) MATLAB
function s = mySilhouette(X, IDX)
    %# X  : matrix of size N-by-p, data where rows are instances
    %# IDX: vector of size N, cluster index of each instance (starting from 1)
    %# s  : vector of size N, silhouette score value of each instance

    N = size(X,1);            %# number of instances
    K = numel(unique(IDX));   %# number of clusters

    %# compute pairwise distance matrix
    D = squareform( pdist(X,'euclidean').^2 );

    %# indices belonging to each cluster
    kIndices = accumarray(IDX, 1:N, [K 1], @(x){sort(x)});

    %# compute a,b,s for each instance
    %# a(i): average distance from i to all other data within the same cluster.
    %# b(i): lowest average dist from i to the data of another single cluster
    a = zeros(N,1);
    b = zeros(N,1);
    for i=1:N
        ind = kIndices{IDX(i)}; ind = ind(ind~=i);
        a(i) = mean( D(i,ind) );
        b(i) = min( cellfun(@(ind) mean(D(i,ind)), kIndices([1:K]~=IDX(i))) );
    end
    s = (b-a) ./ max(a,b);
end
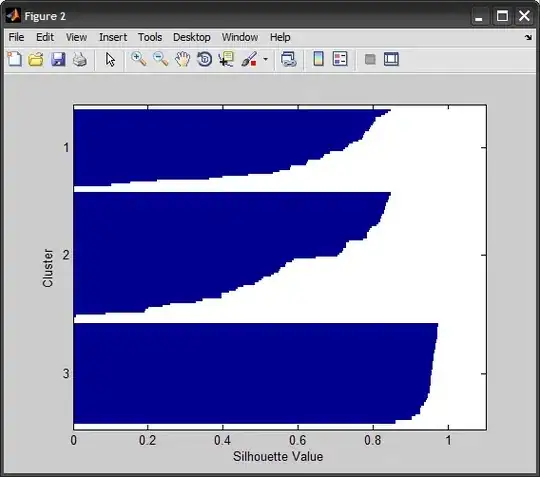
To emulate the plot from the silhouette function in MATLAB, we group the silhouette values by cluster, sort within each, then plot the bars horizontally. MATLAB adds NaNs to separate the bars from the different clusters, I found it easier to simply color-code the bars:
%# sample data
load fisheriris
X = meas;
N = size(X,1);

%# cluster and compute silhouette score
K = 3;
[IDX,C] = kmeans(X, K, 'distance','sqEuclidean');
s = mySilhouette(X, IDX);

%# plot
[~,ord] = sortrows([IDX s],[1 -2]);
indices = accumarray(IDX(ord), 1:N, [K 1], @(x){sort(x)});
ytick = cellfun(@(ind) (min(ind)+max(ind))/2, indices);
ytickLabels = num2str((1:K)','%d');           %#'

h = barh(1:N, s(ord),'hist');
set(h, 'EdgeColor','none', 'CData',IDX(ord))
set(gca, 'CLim',[1 K], 'CLimMode','manual')
set(gca, 'YDir','reverse', 'YTick',ytick, 'YTickLabel',ytickLabels)
xlabel('Silhouette Value'), ylabel('Cluster')

%# compare against SILHOUETTE
figure, silhouette(X,IDX)
2) Python
And here is what I came up with in Python:
import numpy as np
from scipy.cluster.vq import kmeans2
from scipy.spatial.distance import pdist, squareform
from sklearn import datasets
import matplotlib.pyplot as plt
from matplotlib import cm

def silhouette(X, cIDX):
    """
    Computes the silhouette score for each instance of a clustered dataset,
    which is defined as:
        s(i) = (b(i)-a(i)) / max{a(i),b(i)}
    with:
        -1 <= s(i) <= 1

    Args:
        X    : A M-by-N array of M observations in N dimensions
        cIDX : array of len M containing cluster indices (starting from zero)

    Returns:
        s    : silhouette value of each observation
    """

    N = X.shape[0]              # number of instances
    K = len(np.unique(cIDX))    # number of clusters

    # compute pairwise distance matrix
    D = squareform(pdist(X))

    # indices belonging to each cluster
    kIndices = [np.flatnonzero(cIDX==k) for k in range(K)]

    # compute a,b,s for each instance
    a = np.zeros(N)
    b = np.zeros(N)
    for i in range(N):
        # instances in same cluster other than instance itself
        a[i] = np.mean( [D[i][ind] for ind in kIndices[cIDX[i]] if ind!=i] )
        # instances in other clusters, one cluster at a time
        b[i] = np.min( [np.mean(D[i][ind])
                        for k,ind in enumerate(kIndices) if cIDX[i]!=k] )
    s = (b-a)/np.maximum(a,b)

    return s

def main():
    # load Iris dataset
    data = datasets.load_iris()
    X = data['data']

    # cluster and compute silhouette score
    K = 3
    C, cIDX = kmeans2(X, K)
    s = silhouette(X, cIDX)

    # plot
    order = np.lexsort((-s,cIDX))
    indices = [np.flatnonzero(cIDX[order]==k) for k in range(K)]
    ytick = [(np.max(ind)+np.min(ind))/2 for ind in indices]
    ytickLabels = ["%d" % x for x in range(K)]
    cmap = cm.jet( np.linspace(0,1,K) ).tolist()
    clr = [cmap[i] for i in cIDX[order]]

    fig = plt.figure()
    ax = fig.add_subplot(111)
    ax.barh(range(X.shape[0]), s[order], height=1.0,
            edgecolor='none', color=clr)
    ax.set_ylim(ax.get_ylim()[::-1])
    plt.yticks(ytick, ytickLabels)
    plt.xlabel('Silhouette Value')
    plt.ylabel('Cluster')
    plt.show()

if __name__ == '__main__':
    main()

Update:
As noted by others, scikit-learn has since then added its own silhouette metric implementation. To use it in the above code, replace the call to the custom-defined silhouette function with:
from sklearn.metrics import silhouette_samples

...

#s = silhouette(X, cIDX)
s = silhouette_samples(X, cIDX)    # <-- scikit-learn function

...
the rest of the code can still be used as-is to generate the exact same plot.
Amro
- 123,847
- 25
- 243
- 454
-
Sorry I did not get back to this earlier. Thank you very much for spending so much time on this. Really appreciate it. From my preliminary run on my data, the results look very nice! – Legend Jul 19 '11 at 18:23
-
Hi, Amro. I want to know, what is the meaning of `D = squareform( pdist(X,'euclidean').^2 )` I have 5 rows and 3 coloumns, and D gives me 5 rows and 5 coloumns. What formula is it? How it works? Or could you please show me some source link about this calculating? Thank you. :) – Alvi Syahrin May 30 '13 at 12:17
0
This is a little late, but for what it is worth, it appears that scikits-learn now implements a silhouette function. See their documentation page or view the source code directly.
Zach R
- 21
- 5
0
I've looked, but I can't find a numpy/scipy silhouette function, I even looked in pylab and matplotlib. I think you'll have to implement it yourself.
I can point you to http://orange.biolab.si/trac/browser/trunk/orange/orngClustering.py?rev=7462. It has a few functions which implement a silhouette function.
Hope this helps.
James Hurford
- 2,018
- 19
- 40