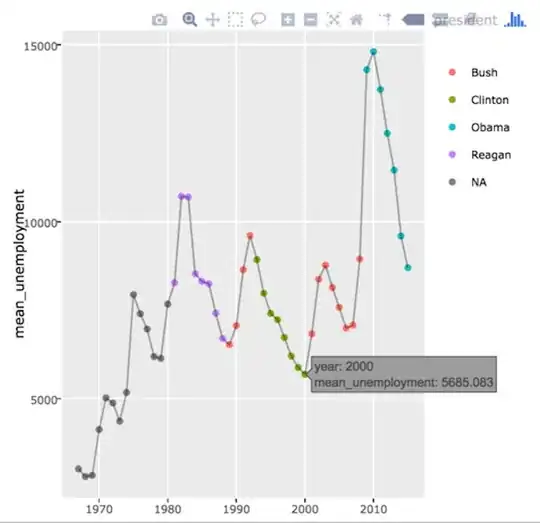
Is basically the problem described here Plotting an xts object using ggplot2
But I can not adapt it to plot two series, the code is the following:
dates <- c("2014-10-01", "2014-11-01", "2014-12-01", "2015-01-01", "2015-02-01")
values1 <- as.numeric(c(1,2,3,4,5))
values2 <- as.numeric(c(10,9,8,7,6))
new_df <- data_frame(dates, values1, values2)
new_df$dates <- as.Date(dates)
new_df <- as.xts(new_df[, -1], order.by = new_df$dates)
Now I use ggplot:
ggplot(new_df, aes(x = Index, y = c(values1, values2)))
+ geom_point()
but I get the following error:
Error: Aesthetics must be either length 1 or the same as the data (5): y Run
rlang::last_error()to see where the error occurred.
It is possible to have both series of this object on the same plot?


