You can do this with as long as your dataset can be updated to support it.
First I grabbed some sample datetime data I had and inserted it into a table variable called @t. You'll just need to swap out @t for your actual table name. This gave me the following
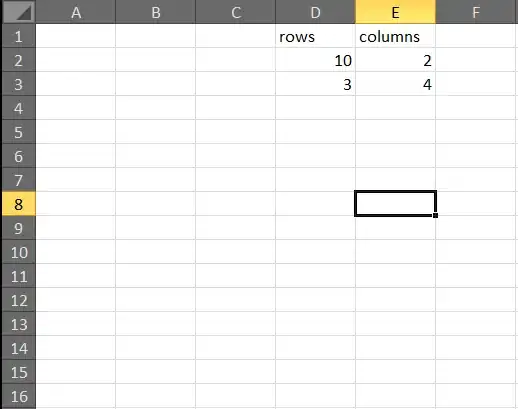
Then I take this data and workout the row and column the data should sit in. In this example I am using a parameter to define the number of columns I want. You could do this and pass it in from your report if it's helpful, or just change it to a staic value. I'll demo with the parameter being passed in though.
Here's the query (Note you'll need to comment out the @Columns declaration if you want to pass this in from your report but for now we are just testing in SSMS or similar.
-- REPLACE @t with your actual tablename below
DECLARE @Columns int = 2 -- <= comment this out when you copy into your dataset query

SELECT
    *
    , ColumnNum = ((SortOrder-1) % @Columns) + 1
    , RowNum = ROW_NUMBER() OVER(PARTITION BY GroupID, SortOrder % @Columns ORDER BY SortOrder)
    FROM(
        SELECT
                ROW_NUMBER() OVER(PARTITION BY GroupID ORDER BY dt) as SortOrder,
                GroupID, dt
            FROM @t) x
    ORDER BY GroupID, SortOrder
This gives us the following output

Now all we have to do is use a matrix control in the report to display it correctly.
- Create a new report
- Add a datsource and dataset
- Set your dataset query as above remember to comment out the
DECLARE @Columns line if you want to parameterise it.
- Add a matrix control
- Drag
RowNum to the 'Rows' placeholder, dt to the 'data' placeholder and finally select ColNum in the columns placeholder
The matrix should look like this (we're not finished yet...)

- In the row groups panel, drag GroupID above the exiting row group (above rownum in my example) so it creates a parent group.
- Finally, add a blank row inside the RowGroup group by right-clicking the rownum textbox and doing "Insert Row, Inside Group - Below". This will just give us a gap between groups
Note: I've changed the colour of the rownum and columnnum text boxes as we can delete these once testing is complete.
The final design should look like this.

When we run the report and set the parameter to 2 we get this
set it to 3 and we get this
You can now remove the top row and middle column to get rid of the row and column numbers. If you want to have a group header as in your sample. Add a row inside the group again but this time at the top and then add an expression to give your desired title.


