2

My Y-Axis keys (or ticks) are pretty long, and they're being truncated But it's not due to lack of sufficient width for the graph itself, using the inspect tool, I can see there's enough space allocated for it, but the frame that is allocated to the whole graph is not sufficient... and that's supposed to be the ResponsiveBar...

image

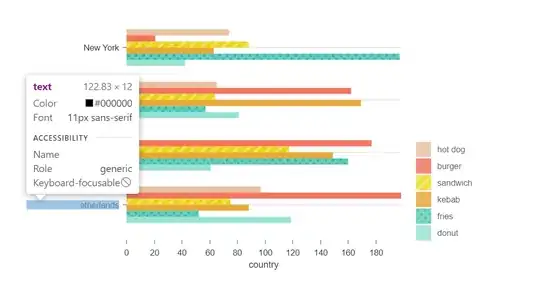
changing the "transform" value for the X-Axis makes the text appear in full (almost), but then the legends are being truncated:

image

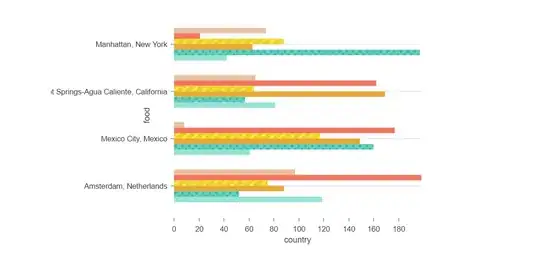
How can I make them appear in full? Couldn't find my answer in the docs.

Here's a sandbox to reproduce the problem: https://codesandbox.io/s/missing-legends-text-pns6v

IMPORTANT: 'width' is not the problem, it is somehow covered with a sort of a white line... also, I tried many 'width' sizes

The problem I'm referring to is this: image

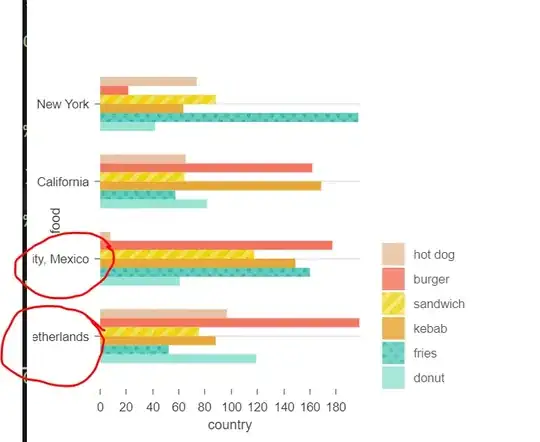
Would love to hear if there's a way to wrap the text, or truncating with adding on hover effect to show the full text

sale108
  • 577
  • 7
  • 22

1 Answers1

9

solution 1 : increase margin

You can set the left property in margin of ResponsiveBar. In the following example set to 240px:

<ResponsiveBar
  ........
  margin={{ top: 50, right: 150, bottom: 50, left: 240 }}
  ........
/>

You will also need to update the container style to expand the chart setting the margin to 0 for example :

style={{
    .....
    margin: "0"
}}

Result: enter image description here

Sandbox

solution 2: tooltip

If you don't want to increase the margin, you can override the format function in axisLeft props and :

  • cut the string like New York, Manhatta...
  • add a <title> tag to display a tooltip :
axisLeft={{
    format: (v) => {
        return v.length > 10 ? (
            <tspan>
            {v.substring(0, 10) + "..."}
            <title>{v}</title>
            </tspan>
        ) : (
            v
        );
    },
    tickSize: 5,
    tickPadding: 5,
    tickRotation: 0,
    legend: "",
    legendPosition: "middle",
    legendOffset: -40
}}

checkout this post

Sandbox

enter image description here

Bertrand Martel
  • 42,756
  • 16
  • 135
  • 159
  • Hi, Thanks a lot for your answer. Unfortunately, this solution is not consistent The left margin value needs to be changed in correspondence to the largest text length on the left axis. So, if I put the chart on my website for users to use, setting a hard-coded left-margin value can't guarantee the text won't be truncated at all times. Furthermore, setting the left-margin value too high, completely crunches the chart, make it bad-formatted and hard to read. Would love to hear if there's a way to wrap the text, or truncating with adding onHover effect ot show the full text. Thanks! – sale108 Mar 04 '21 at 09:17
  • 1
    thanks! I'll mark this as an answer. 2 Questions: 1. Is there a way to wrap texts? because I have tried something similar to what you did, but the '\n' char was ignored 2. Also, I used the 'format' but I didn't know I can use for a tool tip? where did you learn about this option? Thanks again – sale108 Mar 04 '21 at 18:51
  • @sale108 you can see [this post](https://stackoverflow.com/questions/10643426/how-to-add-a-tooltip-to-an-svg-graphic/10643523#10643523) for creating a tooltip in svg – Bertrand Martel Mar 04 '21 at 18:52
  • @sale108 wraping text with `\n` is a bit tricky on the y axis. You can use a `tspan` using something like ` {`${text[0]}`} {`${text[1]}`} ` but is seems the distance is not linear between items from the 2nd to the 3rd new line. This works fine on the x axis though – Bertrand Martel Mar 04 '21 at 18:55
  • @sale108 or more like ` {`${text[0]}`} {`${text[1]}`} {`${text[2]}`} ` – Bertrand Martel Mar 04 '21 at 18:55