1

In some situations, TradingView Lightweight Charts draws too few tick marks on the price scale (ie: too few horizontal grid lines). Is there any way to control the number/density of tick marks?

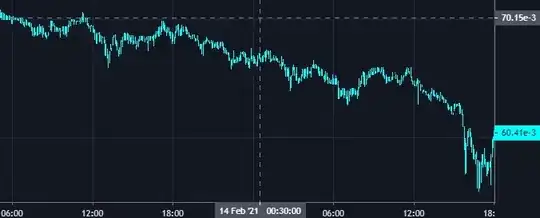
In the example below, only two horizontal tick marks are drawn, even when the chart is rendered quite a bit bigger. It would be good if it drew twice as many horizontal grid lines in this instance:

  • What `priceFormat` options you provide to the series options? – timocov Feb 15 '21 at 09:35
  • I'm using a custom formatter function for better display of really small numbers. – Thunderbelch Feb 15 '21 at 13:08
  • So can you provide jsfiddle reproduction please and what you'd like to see instead? – timocov Feb 16 '21 at 09:26
  • I believe it has the minimum tick size of 0.01 (great for dollars, etc, not so good for satoshis). Looking for the same answer myself of how to change that. As for number formatting on axis - localization: { priceFormatter: price => parseFloat(price).toFixed(8), }, inside `createChart` options object. – Tautvydas Bagdžius Feb 23 '21 at 13:57

1 Answers1

1

Found the answer. Key here is do change precision/minMove as follows:

            candleSeries.applyOptions({
                priceFormat: {
                    type: 'custom',
                    minMove: 0.00000001,
                    formatter: price => parseFloat(price).toFixed(8),
                },
            });

Documentation: https://github.com/tradingview/lightweight-charts/blob/master/docs/series-basics.md#price-format