I see you have fallen for the classical trap of "The first page of the manual is not representative of the tool".(1)
Besides various UML diagrams (like the sequence diagram you encounered), PlantUML has support for various other Software development related formats (such as archimate, Block diagram, bpmn, c4, Computer network diagrams, erd, gantt chart, Mind maps, and wbd), as well as visualization of json and yaml files.
In fact, it even understands Graphviz syntax!(2)
Because of all of this, "intuitive" doesn't happen until you have some basic knowledge of PlantUML.
So back to your issue... What you are seeing isn't what you think it is.
What is that?
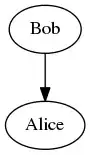
Relating things to Graphviz, instead of this:
digraph d {
    Bob -> Alice : hello
}
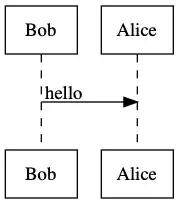
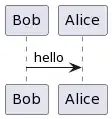
You are actually seeing this:(3)
@startuml
digraph sequenceDiagramExample {
  bobHead [ label="Bob" pos="0,1.5!" shape="record" ];
  bobPoint0 [ pos="0,0.75!" shape="point" width="0" ]
  bobFoot [ label="Bob" pos="0,0!" shape="record" ];
  aliceHead [ label="Alice" pos="1,1.5!" shape="record" ];
  alicePoint0 [ pos="1,0.75!" shape="point" width="0" ]
  aliceFoot [ label="Alice" pos="1,0!" shape="record" ];
  bobHead -> bobPoint0 -> bobFoot [ dir="none" style="dashed" ]
  aliceHead -> alicePoint0 -> aliceFoot [ dir="none" style="dashed" ]
  bobPoint0 -> alicePoint0 [ label="hello" labelloc="c" style="solid" ]
}
@enduml
Gimme an example!
What an example with just two nodes and an arrow between them looks like depends on the kind of graph chosen...
What you have to remember is that, with Graphviz, you have to apply all meaning to a diagram yourself. With PlantUML, the meaning is provided by PlantUML for you. All you need to do is tell PlantUML what you mean.
With a few basic pointers, this becomes intuitive quite quickly. You just need to know what kind of diagram you want to draw before starting...
As you can see from the examples below, PlantUML is a very powerful tool to add to your software developer toolbelt.
I hope the examples will help to make things more intuitive, and that your first misstep won't keep you from exploring PlantUML further!
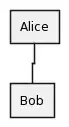
Activity
@startuml
:Alice;
:Bob;
@enduml
Archimate
@startuml
archimate #Application Alice
archimate #Business Bob
Alice -> Bob
@enduml

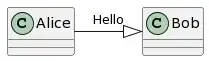
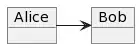
Class
@startuml
Alice -|> Bob: Hello
@enduml
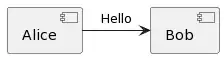
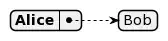
Component
@startuml
[Alice] -> [Bob]: Hello
@enduml
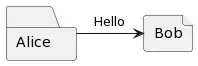
Deployment
@startuml
folder Alice
file Bob
Alice -> Bob: Hello
@enduml
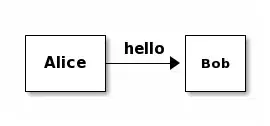
Ditaa
@startditaa

+-------+       +-----+
|       | hello |     |
| Alice +------>| Bob |
|       |       |     |
+-------+       +-----+
@endditaa
Gantt
@startgantt
[Alice]->[Bob]
@endgantt

JSON
@startjson
{
  "Alice": ["Bob"]
}
@endjson
MindMap
@startmindmap
+ Alice
++ Bob
@endmindmap
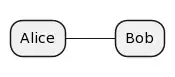
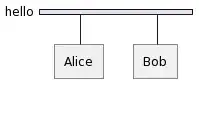
Network
@startuml
nwdiag {
  network hello {
    Alice;
    Bob;
  }
}
@enduml
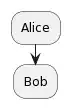
Object
@startuml
object Alice
object Bob
Alice -> Bob
@enduml
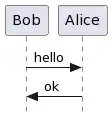
Sequence
@startuml
Bob -> Alice : hello
@enduml
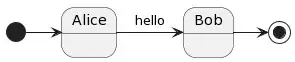
State
@startuml
[*] -> Alice
Alice -> Bob: hello
Bob -> [*]
@enduml
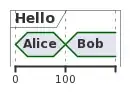
Timing
@startuml
concise Hello
0 is Alice
+100 is Bob
@enduml
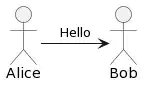
Use Case
@startuml
:Alice: -> :Bob: : Hello
@enduml
WBS
@startwbs
+ Alice
++ Bob
@endwbs
Footnotes
- It's not realy a classic, I just made that up. But it is something that commonly happens.
- Reference the manual here: https://plantuml.com/dot
- Rendered in
neato not dot, see https://stackoverflow.com/a/53470455/153049