3

Maybe a stupid question. I'm new to TradingView and pine script, so please bear with me if there's some simple way to do this...

I figured out how to copy and modify a script from the library. At first, I could see a tiny edge of a window at the bottom of the script. When I saved or attempted to add the script to the chart, the window showed whether the script processed or had errors.

Now, though, I seem to have "lost" that window. How can I display that window? Also, once displayed, how can I make it larger?

Edit: Here's a screenshot of the bottom of my editor -
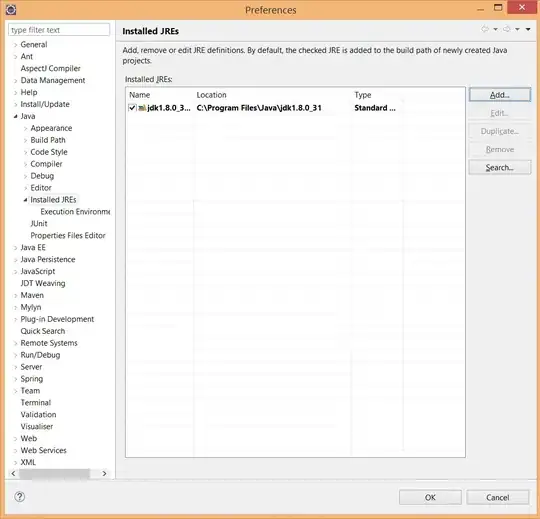
Bottom of pine script editor, where log window should appear

leanne
  • 7,940
  • 48
  • 77

5 Answers5

3

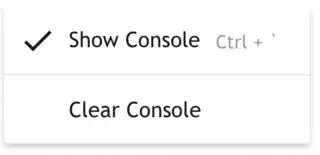
Right-clicking on the console (errors) window showed a little pop-up saying:

Console right-click menu

While my cursor is in the editor window, holding Ctrl (or Cmd on a Mac) plus the backtick key toggles the console window open and closed.

Now, I can see the console log window whether I have errors or not.

leanne
  • 7,940
  • 48
  • 77
0

you can show/hide the pane with pine scripts with the "_" icon on the right side:

show hide

On the rigt side next to the "_" icon you can toggle/maximize the pine script window.

kittiwake
  • 1
  • 1
  • Thanks, @kittiwake. Those icons show/hide the entire pine script window. I'm looking for the window underneath that shows script errors. – leanne Jan 29 '21 at 18:03
  • You can click on "Add to Chart" to redisplay the error messages. – kittiwake Jan 29 '21 at 18:26
  • I've done that, but the error window still isn't coming up. Even when it *was* displaying before, it was just a sliver of a window. But it's not displaying at all now. – leanne Jan 29 '21 at 18:39
  • I've added a screenshot of the bottom of my editor/browser window: no error log window. – leanne Jan 29 '21 at 18:43
  • This error is very frustrating. I somehow lost the console as well, I now there is an error in the code and cannot see where. The consolidate disappeared. and while I can right click on Pine Editor and see "Toggle console", nothing happens after clicking on that. – Camilo Jan 22 '23 at 22:38
0

Add any error to your script and save the script. In the lower left corner, you will see a small gray triangle. Drag it up with the mouse.

enter image description here

Dharman
  • 30,962
  • 25
  • 85
  • 135
AnyDozer
  • 2,236
  • 2
  • 5
  • 22
  • When I purposely added some garbage text, I was able to see the error logging window again. That was the key: when I added the chart *without* any errors, the gray triangle didn't come up. Wow, it would be nice if there were a specific icon on the side, say, or by the editor's maximize/minimize buttons, to open that window. Maybe some feedback their way... – leanne Jan 29 '21 at 19:30
0

The "Show console" was never visible in my browser. Only the "Toggle console", which did not do anything for me.

I tried a different browser and the console showed well. So I figure it was the browser I was using "Firefox".

So, I re-started Firefox, by going to Un-install Programs in Windows, clicking "Remove program", in front of the Firefox logo, which gave me the choice to restart Firefox. I did took that choice and this fixed the problem for me. I hope it helps others.

Camilo
  • 153
  • 7
0

On Firefox, it may bug and never show it even with the shortcuts (because it becomes a tiny single-line that can't be dragged at the bottom of the page).

In order to fix it without uninstalling firefox: clean the site data for the domain. enter image description here

j riv
  • 3,593
  • 6
  • 39
  • 54