Set the 'XColor','YColor' axes properties. Note that these properties determine the color of the axis lines, tick marks, tick mark labels, and the axis grid lines, so AFAIK you can't assign those different colors than that of the entire axis..
Example:
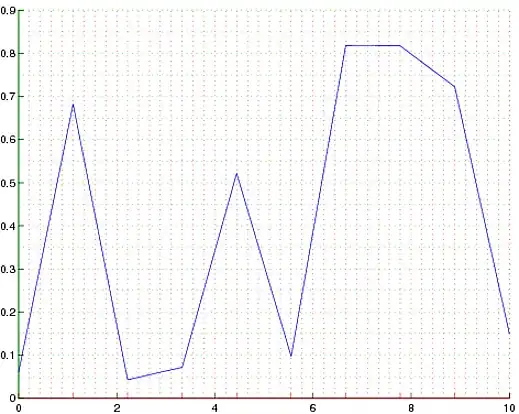
plot(rand(10,1))
set(gca, 'XMinorGrid','on', 'YMinorGrid','on', 'XColor','r', 'YColor','g')
EDIT1:
You can always create a second transparent axis with the desired grid colors, but with no ticks or labels, stacked on top of the current axis. Here is an example:
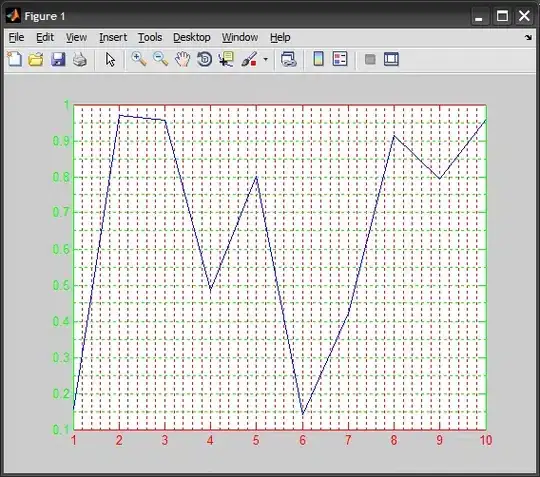
%# create plot as usual
plot(rand(10,1))
hAx1 = gca;

%# create a second axis, same position/extents, no tick or labels, colored grid-lines
hAx2 = axes('Position',get(hAx1,'Position'), ...
    'Color','none', 'TickLength',[1e-100 1e-100], ...
    'XMinorGrid','on', 'YMinorGrid','on', ...
    'Box','off', 'XColor','g', 'YColor','r', ...
    'XTickLabel',[], 'YTickLabel',[], ...
    'XTick',get(hAx1,'XTick'), 'YTick',get(hAx1,'YTick'), ...
    'XLim',get(hAx1,'XLim'), 'YLim',get(hAx1,'YLim'));

%# position it on top
%#uistack(hAx2,'top')

%# redraw the enclosing box in the original axis colors
x = get(hAx1,'XLim');
y = get(hAx1,'YLim');
line([x([1 2]) nan x([2 1])],[y([1 1]) nan y([2 2])],'Color',get(hAx1,'XColor'))
line([x([1 1]) nan x([2 2])],[y([1 2]) nan y([2 1])],'Color',get(hAx1,'YColor'))
The only problem is that the grid lines are drawn on top of your plot, which might get in the way if the grid-lines are thick :)
EDIT2:
Seems like @yoda had a similar idea to the above. Here is a slightly improved version inspired by his solution:
%# create plot as usual
plot(11:20, rand(10,1)*5)
hAx1 = gca;   %# get a handle to first axis

%# create a second transparent axis, same position/extents, same ticks and labels
hAx2 = axes('Position',get(hAx1,'Position'), ...
    'Color','none', 'Box','on', ...
    'XTickLabel',get(hAx1,'XTickLabel'), 'YTickLabel',get(hAx1,'YTickLabel'), ...
    'XTick',get(hAx1,'XTick'), 'YTick',get(hAx1,'YTick'), ...
    'XLim',get(hAx1,'XLim'), 'YLim',get(hAx1,'YLim'));

%# show grid-lines of first axis, give them desired color, but hide text labels
set(hAx1, 'XColor','g', 'YColor','r', ...
    'XMinorGrid','on', 'YMinorGrid','on', ...
    'XTickLabel',[], 'YTickLabel',[]);

%# link the two axes to share the same limits on pan/zoom
linkaxes([hAx1 hAx2],'xy');

%# lets create a legend, and some titles
legend(hAx1, 'text')
title('title'), xlabel('x'), ylabel('y')

EDIT3 (take 2):
Here is the same example but with a log-scale x-axis. Note how instead of creating a second axis and manually setting its properties to match the first, I simply copyobj the axis, and delete its children.
%# create a plot as usual (x-axis is in the log-scale)
semilogx(logspace(0,5,100), cumsum(rand(100,1)-0.5))
xlabel('x'), ylabel('y'), title('text')
legend('plot')

%# capture handle to current figure and axis
hFig = gcf;
hAx1 = gca;

%# create a second transparent axis, as a copy of the first
hAx2 = copyobj(hAx1,hFig);
delete( get(hAx2,'Children') )
set(hAx2, 'Color','none', 'Box','on', ...
    'XGrid','off', 'YGrid','off')

%# show grid-lines of first axis, style them as desired,
%# but hide its tick marks and axis labels
set(hAx1, 'XColor',[0.9 0.9 0.9], 'YColor',[0.9 0.9 0.9], ...
    'XMinorGrid','on', 'YMinorGrid','on', 'MinorGridLineStyle','-', ...
    'XTickLabel',[], 'YTickLabel',[]);
xlabel(hAx1, ''), ylabel(hAx1, ''), title(hAx1, '')

%# link the two axes to share the same limits on pan/zoom
linkaxes([hAx1 hAx2], 'xy');

%# Note that `gca==hAx1` from this point on...
%# If you want to change the axis labels, explicitly use hAx2 as parameter.
You should get the correct plot in your example with this code. However I think the x variable values you choose might be too close in the current figure size to show all the vertical lines (simply maximize the figure to see what I mean)...
To get a better idea of what each axis contains, here is a divided view where the plot on the left contains only the graphics rendered by hAx1, while the plot on right contains only the hAx2 components. Those two views are basically overlayed on top of each other in the final figure shown before.