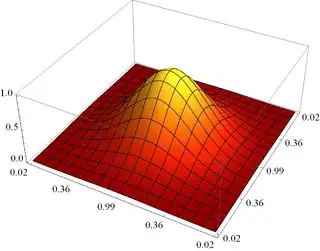
I have a system of nonlinear Ordinary Differential Equations that has 3 parameters as inputs: mu, target, and omega. I am trying the estimate these parameters by minimizing the least squared error between my observed values and the output of the ODE system (x5). I have tried different objective functions as well as different IMODES but the solution never converged. Besides, as I always get no solution found error, I cannot see what the closest best parameters are. Do you have any suggestions for my optimization problem? Thanks!
Here is my yData
My code is:
import numpy as np
import matplotlib.pyplot as plt
from gekko import GEKKO
import pickle

with open('y_observed','rb') as f:
    yData = pickle.load(f)

m = GEKKO()
dt = 0.001
m.time = np.arange(0,1.5,dt)

# Parameters
mu = m.FV(value=0.2, lb=-0.1, ub=1)
omega = m.FV(value=70, lb=0, ub=100)
target = m.FV(value=0.1, lb=-1, ub=3)

# Variables
x1 = m.Var(value=0)
x2 = m.Var(value=0.05)
x3 = m.Var(value=0)
x4 = m.Var(value=0)
x5 = m.Var(value=0.05)
x6 = m.Var(value=0)
y = m.Param(value = yData)
m.Minimize((y-x5)**2)

# Constants
A = 75
B = 70
C = 45

# ODEs
m.Equation(x1.dt()== 1-x1)
m.Equation(x2.dt()== x3)
m.Equation(x3.dt()== x1*70*(x1*B*0.25*(target-x2) - x3))
m.Equation(x4.dt()== C*(mu - x4))
m.Equation(x5.dt()== A*1.0/np.abs(mu)*(x4 - ((x5-x2)**2 + x6**2))*(x5-x2) - omega*x6)
m.Equation(x6.dt()== A*1.0/np.abs(mu)*(x4 - ((x5-x2)**2 + x6**2))*x6 + omega*(x5-x2))


#Application options
m.options.SOLVER = 3 #APOPT solver
m.options.IMODE = 5 #Dynamic Simultaneous - estimation
m.options.EV_TYPE = 2 #absolute error
#m.options.NODES = 3 #collocation nodes (2,5)

if True:
    mu.STATUS=1
    target.STATUS=1
    omega.STATUS=1

m.solve(disp=True)

print('Objective: ' + str((x5-yData)**2))

print('Solution')
print('mu = ' + str(mu.value[0]))
print('omega = ' + str(omega.value[0]))
print('target = ' + str(target.value[0]))

plt.figure(1)

plt.subplot(2,1,1)
plt.plot(m.time,x5.value,'k:',LineWidth=2,label=r'$x_5$')
plt.plot(m.time,yData,'b-',LineWidth=2,label=r'$yData$')
plt.ylabel('Value')
plt.legend(loc='best')

plt.subplot(2,1,2)
plt.plot(m.time,mu.value,'r-',LineWidth=2,label=r'$mu$')
plt.plot(m.time,target.value,'r-',LineWidth=2,label=r'$target$')
plt.plot(m.time,omega.value,'r-',LineWidth=2,label=r'$omega$')
plt.legend(loc='best')
plt.xlabel('Time')
plt.ylabel('Value')

plt.show()
