9

I am working on Histogram of Oriented Gradient(HOG) features and I am trying to implement the trilinear interpolation of histogram bins as described in Dalal's PhD thesis. And he explains the interpolation process as cited below:

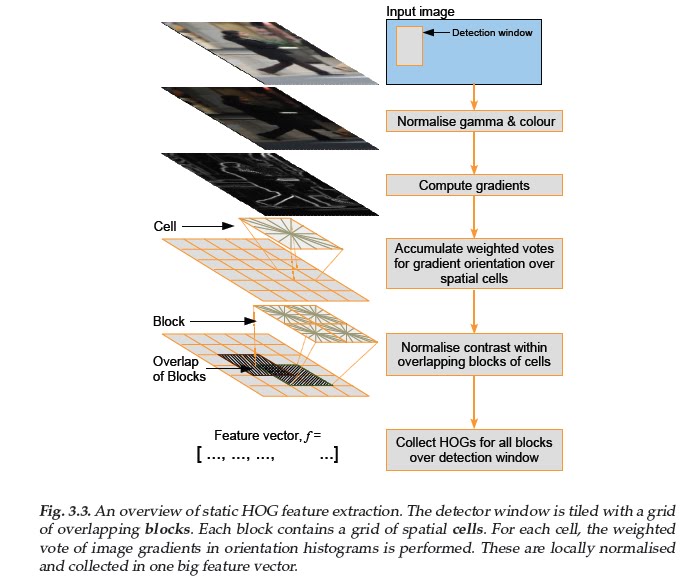
EDIT: Roughly speaking, HOG features are extracted from a 64x128 pixel window which is divided into blocks. Each block consists of 2x2 cells and a cell is 8x8 pixel area. Extraction starts with calculating first order derivatives of image, then orientation and magnitude of each pixel are calculated. An orientation histogram within the block for each 8x8 pixel cell is calculated where pixels contribute to the histogram with the magnitude value, based on the orientation of the pixel, and magnitude is interpolated between the neighbouring bin centres in both orientation and position. Histogram contains 9 bins represents 0-180 degrees with stride of 20 degrees. An overall depiction of the algorithm can be seen here: http://4.bp.blogspot.com/_7NBDeKCsVHg/TKBbldI8GmI/AAAAAAAAAG0/G-OXUz1ouPQ/s1600/a1.bmp

We first describe linear interpolation in a one dimension space and then extend it to 3-D. Let h be a histogram with inter-bin distance(bandwidth) b. h(x) denotes the value of the histogram for the bin centred at x. Assume that we want to interpolate a weight w at point x into the histogram. Let x1 and x2 be the two nearest neighbouring bins of the point x such that x1 ≤ x < x2. Linear interpolation distributes the weight w into two nearest neighbours as follows linear interpolation

Let w at the 3-D point x = [x, y, z] be the weight to be interpolated. Let x1 and x2 be the two corner vectors of the histogram cube containing x, where in each component x1 ≤ x < x2. Assume that the bandwidth of the histogram along the x, y and z axis is given by b = [bx, by, bz]. Trilinear interpolation distributes the weight w to the 8 surrounding bin centres as follows: trilinear interpolation formula

.

We compute histogram for cells and every pixel contributes with its magnitude value to the histogram. What I understand from the formulation is that x and y represents the location of the cells in the detection window and z is the bin number. In a 64x128 detection window, there are 8x16 cells and 9 orientation bins so that our histogram is represented as h(8,16,9). If above statements are correct, do (x1,y1) and (x2,y2) represent previous and letter cells respectively? Does z1 and z2 mean the previous and letter orientation bins? What about bandwidth b=[bx, by, bz]?

I'd be really appreciated if someone can clarify these issues.

Thanks.

Ahmet Keskin
  • 1,025
  • 1
  • 15
  • 25
  • 1
    This seems to be the original reference: http://lear.inrialpes.fr/people/dalal/NavneetDalalThesis.pdf – whoplisp Jul 03 '11 at 20:45
  • Yes, this is the original reference. Thank you! – Ahmet Keskin Jul 03 '11 at 20:48
  • See the thesis page 117 for the OPs picture. The construction of histograms is depicted on page 95. – whoplisp Jul 03 '11 at 20:54
  • Have you tried to make a 3D scatter plot of such a histogram? I think that would be instructive and might explain why they do the interpolation. – whoplisp Jul 03 '11 at 20:58
  • It would be helpful if you could explain what information is binned into the histograms. It seems to involve at least scale-space pyramids and 2d optical flow fields. – whoplisp Jul 03 '11 at 21:03
  • Edited my question. In my case, I am working on R-HOG, and scale space and 2d optical flow is not important at this stage. The reason that the histogram is interpolated is to prevent the aliasing effects. – Ahmet Keskin Jul 03 '11 at 21:40

2 Answers2

5

Think of (x1, y1, z1) and (x2, y2, z2) as two points spanning a cube that surrounds the point (x,y,z) for which you want to interpolate a value of h. The set of eight points (x1, y1, z1), (x2, y1, z1), (x1, y2, z1), (x1, y1, z2), (x2, y2, z1), (x2, y1, z2), (x1, y2, z2), (x2, y2, z2) forms the complete cube. So trilinear interpolation between (x1, y1, z1) and (x2, y2, z2) actually means interpolation between the 8 points in the 3D histogram space surrounding the point you are interested in! Now to your questions:

(x1, y1), (x2, y2) (and (x1,y2) and (x2, y1) represent the centers of bins in the (x,y) plane. In your case these would be the orientation vectors.

z1 and z2 represent two bin levels in the orientation direction, as you say. Combined with the four points in the image plane this gives you a total of 8 bins.

The bandwidth b=[bx, by, bz] is basically the distance between the centers of neighbouring bins in the x, y and z direction. In your case, with 8 bins in the x-direction and 64 pixels in that direction, 16 bins in the y direction and 128 pixels in the y direction:

bx = 8 pixels
by = 8 pixels

This leaves bz, for which I actually need more data, because I don't know the full range of your gradient (i.e. lowest to highest possible value) but if that range is rg then:

bz = rg/9

In general, the bandwidth in any direction equals the full available range in that direction divided by the number of bins in that direction.

For a good explanation of trilinear interpolation with pictures look at the link in whoplisp's answer.

Community
  • 1
  • 1
jilles de wit
  • 7,060
  • 3
  • 26
  • 50
  • Thank you for the good explanation. So, lets say that we are calculating the histogram of (1,1) index in the block, and the orientation of pixel is 75 degrees and the magnitude is 13. If there is no interpolation, this pixel contributes to the 4th bin in the histogram so that our variables are x=1, y=1, z=4. Therefore, x1=0, x2=2, y1=0, y2=2, z1=3, z2=5 because x1 ≤ x < x2, which means that the pixel does not contribute to its own histogram and bin (x,y,z) at all. I feel like I am missing a point or still confused with x, x1, x2. – Ahmet Keskin Jul 04 '11 at 09:57
  • You should read the "neighbours" not as the neighbours of the bin the new (x,y,z) value falls in, but as the set of 8 bins the centers of which are closest to the new (x,y,z) value. So you are looking for cube formed by the eight bin centers directly surrounding your new value. – jilles de wit Jul 04 '11 at 12:09
3

Lets first look at rectangular HOG. A picture is divided into a few tiles as shown on page 32. Page 46 shows an R-HOG descriptor in (f). Page 49 explains how the data is binned.

I learned how to do 3D interpolation by reading Paul Burke's write-up: http://paulbourke.net/miscellaneous/interpolation/

Sorry, I would have to generate my own images, in order to understand what is going on. It is certainly an interesting technique.

whoplisp
  • 2,508
  • 16
  • 19