I just found out that a BarChart may get cropped when using Frame rather than Axes.
Example:
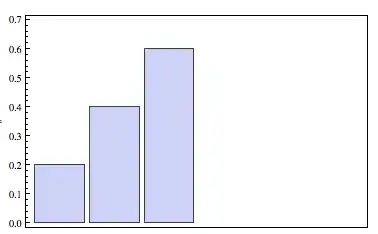
data = {.2, .4, .6, 0., 0., 0.}
BarChart[data]
BarChart[data, Frame -> True, Axes -> False]
Is this a feature or a bug? If it is a feature, is there an easy way to prevent cropping?
EDIT
Screenshot, per request: