0

I'm working on a project which involves determining the volume of a transparent liquid (or air if it proves easier) in a confined space. The images I'm working with are a background image of the container without any liquid and a foreground image which may be also be empty in rare cases, but most times is partly filled with some amount of liquid. Left: Background image; Right: Foreground image (darker area to the left is liquid

While it may seem like a pretty straightforward smooth and threshold approach, it proves somewhat more difficult. I'm working with a set with tons of these image pairs of background and foreground images, and I can't seem to find an approach that is robust enough to be applied to all images in the set. My work so far involves smoothing and thresholding the image and applying closing to wrap it up.

bg_image = cv.imread("bg_image", 0)
fg_image = cv.imread("fg_image", 0)

blur_fg = cv.GaussianBlur(fg_image, (5, 5), sigmaX=0, sigmaY=0)
thresholded_image = cv.threshold(blur_fg, 186, 255, cv.THRESH_BINARY_INV)[1]

kernel = np.ones((4,2),np.uint8)
closing = cv.morphologyEx(thresholded_image, cv.MORPH_CLOSE, kernel)

The results vary, here is an example when it goes well: Decent volume estimation

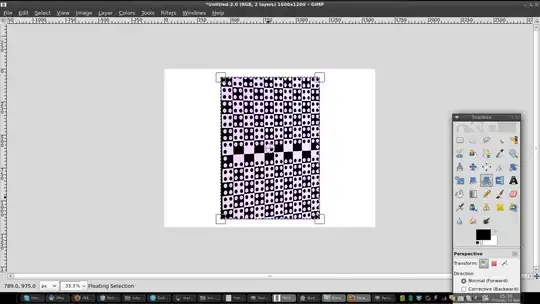
In other examples, it doesn't go as well: Poor volume estimation

Aside from that, I have also tried:

  1. Subtraction of the background and foreground images
  2. Contrast stretching
  3. Histogram equalization
  4. Other thresholding techniques such as Otsu

The main issue is that the pixel intensities in air and liquid sometime overlap (and pretty low contrast in general), causing inaccurate estimations. I am leaning towards utilizing the edge that occurs between the liquid and air but I'm not really sure how..

I don't want to overflow with information here so I'm leaving it at that. I am grateful for any suggestions and can provide more information if necessary.

EDIT:

Here are some sample images to play around with.

bg_1

fg_1

bg_2

fg_2

Community
  • 1
  • 1
okka
  • 1
  • 1
  • _I am leaning towards utilizing the edge that occurs between the liquid and air but I'm not really sure how._ From the three given images, it seems, that the mentioned "edge" is quite dark compared to both surrounding areas. Have you tried building some gradient image (horizontal gradient only) like also used for edge detection (Canny, Sobel)? Also, please post some actual input images (not those plots), so that people here can play around. – HansHirse Jan 04 '21 at 11:28
  • I have used Canny edge detection, but have not built a gradient image. But say that a clear edge can be singled out, how may that aid in estimating the volume? My thinking was that it could be used to determine the length of the area in which there is liquid. Another approach might be to apply some adapted thresholding to the different areas that are separated by the edge. I've added two pairs of input images. – okka Jan 04 '21 at 13:06

1 Answers1

0

Here is an approach whereby you calculate the mean of each column of pixels in your image, then calculate the gradient of the means:

#!/usr/bin/env python3

import cv2
import numpy as np
import matplotlib.pyplot as plt

filename = 'fg1.png'

# Load image as greyscale and calculate means of each column of pixels
im = cv2.imread(filename, cv2.IMREAD_GRAYSCALE)
means = np.mean(im, axis=0)

# Calculate the gradient of the means
y = np.gradient(means)

# Plot the gradient of the means
xdata = np.arange(0, y.shape[0])
plt.plot(xdata, y, 'bo')           # blue circles
plt.title(f'Gradient of Column Means for "{filename}"')
plt.xlabel('x')
plt.ylabel('Gradient of Column Means')
plt.grid(True)
plt.show()

enter image description here

enter image description here


If you just plot the means of all columns, without taking the gradient, you get this:

enter image description here

enter image description here

Mark Setchell
  • 191,897
  • 31
  • 273
  • 432
  • That's a great start, I'm still however unsure how this may be utilized to estimate the volume (number of pixels in the dark area). – okka Jan 04 '21 at 14:39
  • Not sure I understand. If the transition is at pixel 58 in the first image and pixel 22 in the second image and the images are 118 pixels wide, surely that would make 58/118 of the pixels in the first and 22/118 pixels in the second? – Mark Setchell Jan 04 '21 at 14:47
  • Oh, yes that is true, sorry for being dense.. Is there a way to programmatically determine on which side of the gradient that the liquid is? (in the two examples, the liquid is on the left of the gradient in one case, and to the right of the gradient in the other. – okka Jan 04 '21 at 16:29
  • If you look at the second red plot, you can see that the mean pixel brightness on the left side is markedly darker (lower) than the right. On the first red plot... well, it's anybody's guess which side is darker! – Mark Setchell Jan 04 '21 at 16:32
  • 2
    If you are in control of the lab equipment and photography, maybe you could help yourself by choosing a more contrasting background, or by colouring the liquid or by improving the lighting or by marking the bottom end of the test-tube... – Mark Setchell Jan 04 '21 at 16:39
  • Hmm I figured. Unfortunately the tube and color of the liquid must stay as is. I guess I will have to play around with various pre/post-processing approaches. Thank you for your input! – okka Jan 04 '21 at 16:48
  • @okka: But surely you can improve the illumination. In the second pair of images in the "EDIT" section, it looks like the background illumination changes? Or is the liquid coming from the other way? – Cris Luengo Jan 06 '21 at 03:58
  • @CrisLuengo I *think* the second image has the liquid on the right because if you look carefully at the meniscus it is curved the other way. – Mark Setchell Jan 06 '21 at 08:06
  • Mark is correct, the liquid is to the right in the second image. I'm using a lightboard with diffuse white light for illumination, but I have noticed, as you point out @ChrisLuengo, that there are small differences in each image. – okka Jan 07 '21 at 08:39