Context: I want to do shortest path search for a mobile detector, source system operating in 2D Cartesian coordinates i.e. a 20 m x 10 m space. Using igraph for python, I have created a Lattice graph over these dimensions with vertices corresponding to coordinates that the detector can travel to and edges connecting neighboring vertices. The figure below is created using the layout_grid method from igraph
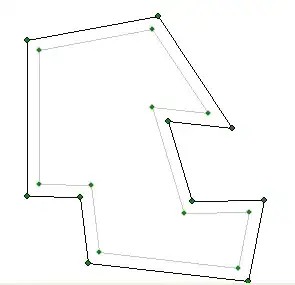
I want to add a simple rectangular obstruction to the space similar to the figure below and correspondingly to the Lattice graph :
Problem: I know that the vertices and edges corresponding to the 2D coordinates of the obstruction need to be removed using the delete_vertices method but I'm not sure how to map the 2D obstruction coordinates to the vertices in the Lattice graph. Any suggestions are appreciated.
Example code:
import numpy as np
from igraph import Graph
#Rectangular obstruction
obstruction = [[5, 0], [10, 0], [10, 5], [5, 5]]
#Create graph
g = Graph().Lattice([20.0,10.0],nei=1,circular=False)
g.delete_vertices([***obstruction coordinates***])
#Coordinates to 2D grid
coords = np.asarray(g.layout_grid(width=int(search_area[2][0])).coords)

