1

I am rather new with Power BI and came across a situation I don't know how to resolve.

I have 2 tables: one with users which contains the user ID and 4 criteria

Users

And one with apartments

Apartments

For each table, I need to create the 6th column:

  • in the User table, for each user, I want to see how many apartments suit him
  • in the Apartment table, for each apartment, I want to see how many users are suited for them.

Some complexities:

  • in the user table, the neighborhoods and number of rooms are stacked (see image)
  • in the user table, the distance to metro is a maximum so if a user selected 15 minutes, all apartments at 5, 10 and 15 minutes are suited for him.

Thank you for your help

Alexis Olson
  • 38,724
  • 7
  • 42
  • 64
  • I don't see a specific question here. What have you tried so far and where are you getting stuck? – Alexis Olson Dec 19 '20 at 18:08
  • Hi Alexis. The question is: How can I get the 2 columns in yellow? - in the User table, for each user, I want to see how many apartments suit him - in the Apartment table, for each apartment, I want to see how many users are suited for them. I am stuck basically from the beginning. – Mihai Enache Dec 19 '20 at 20:30
  • I'm afraid the Users table has an error: How can it have 6 apartment matches, since it requires 3 rooms – sergiom Dec 20 '20 at 15:26

2 Answers2

0

For you User Table you should use this code (probably you must tweak second parameter in substitute based on what you really have (one space? no space?) :

Apartment =
COUNTROWS (
    FILTER (
        CROSSJOIN ( CALCULATETABLE ( Users, VALUES ( 'Users'[User ID] ) ), Apartment ),
        [Price] <= [Budget]
            && VALUE ( PATHITEMREVERSE ( SUBSTITUTE ( Users[Rooms], ",", "|" ), 1 ) ) <= Apartment[Rooms]
            && PATHCONTAINS ( SUBSTITUTE ( [Neighbourhoods], ",", "|" ), [Neighbourhood] )
            && VALUE (
                SUBSTITUTE (
                    SUBSTITUTE ( Apartment[ToMetro], "out of range", 999 ),
                    " minutes",
                    ""
                )
            )
                <= VALUE (
                    SUBSTITUTE (
                        SUBSTITUTE ( Users[ToMetro], "not important", 999 ),
                        " minutes",
                        ""
                    )
                )
    )
)

And for you Apartment Table:

Users = COUNTROWS (
    FILTER (
        CROSSJOIN ( CALCULATETABLE ( Apartment, VALUES ( 'Apartment'[Apartment ID] ) ), Users ),
        [Price] <= [Budget]
            && VALUE ( PATHITEMREVERSE ( SUBSTITUTE ( Users[Rooms], ",", "|" ), 1 ) ) <= Apartment[Rooms]
            && PATHCONTAINS ( SUBSTITUTE ( [Neighbourhoods], ",", "|" ), [Neighbourhood] )
            && VALUE (
                SUBSTITUTE (
                    SUBSTITUTE ( Apartment[ToMetro], "out of range", 999 ),
                    " minutes",
                    ""
                )
            )
                <= VALUE (
                    SUBSTITUTE (
                        SUBSTITUTE ( Users[ToMetro], "not important", 999 ),
                        " minutes",
                        ""
                    )
                )
    )
)
msta42a
  • 3,601
  • 1
  • 4
  • 14
0

It's possible to implement a dynamic solution, that allows to select apartments and users to see how many matches there are for the current selection.
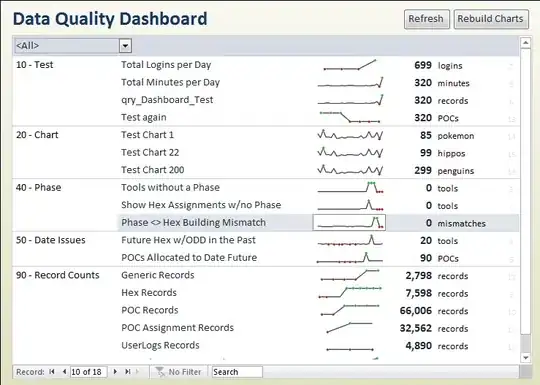
Dynamic matches

But to achieve this we have to create a dimension per each of the columns to be used for the match and also divide some of them using ranges, in this case, the Budget/Price match columns. This is the model we want to create
model

and these are the dimension tables to be added for this particular example

'Prices' table, with the Price ranges to be matced with the budget. The field to be used for the relationship is the PriceTo

Prices table

Neighbouroods table

Neighbouroods table

Numbers of Rooms table
Numbers of rooms table

Proximities to metro table, 1000 when not required (for users) or not available (for apartments)
Proximities to metro table

Using these tables together with the original Users and Apartments, the dimensions, we can now create two calculated fact tables

Apartments Fact table

Apartments Fact =
SELECTCOLUMNS (
    ALLNOBLANKROW ( Apartments ),
    "Apartment ID", Apartments[Apartment ID],
    "Price",
        CALCULATE (
            MAX ( Prices[PriceTo] ),
            REMOVEFILTERS ( Prices ),
            FILTER (
                ALLNOBLANKROW ( Prices ),
                Prices[PriceFrom] < Apartments[Price]
                    && Prices[PriceTo] >= Apartments[Price]
            )
        ),
    "Neighbourhood", Apartments[Neghbourhood],
    "Number of Rooms", Apartments[Number of Rooms],
    "Prximity to metro station",
        IF (
            ISBLANK ( Apartments[Proximity to metro station] ),
            1000,
            Apartments[Proximity to metro station]
        )
)

Users Fact table uses the CROSSJOIN to match all possible combinations of values for stacked fields and ranges, since budget is used as an upper limit

Users Fact = 
SELECTCOLUMNS (
    GENERATE (
        SELECTCOLUMNS (
            Users,
            "User ID", Users[User ID],
            "UsersNeighbourhoods", Users[Neigbourhoods],
            "UserNumberOfRooms", Users[Number of rooms],
            "UserProximityToMetroStation", Users[Proximity to metro station],
            "UserBudget", Users[Budget]
        ),
        VAR PricesTable =
            SELECTCOLUMNS (
                FILTER (
                    ALLNOBLANKROW ( Prices ),
                    Prices[PriceTo] <= [UserBudget]
                ),
                "Price", [PriceTo]
            )
        VAR Neighbouroods =
            FILTER (
                ALLNOBLANKROW ( Neighbourhoods[Neighbourhood] ),
                CONTAINSSTRING (
                    [UsersNeighbourhoods],
                    Neighbourhoods[Neighbourhood]
                )
            )
        VAR Rooms =
            FILTER (
                ALLNOBLANKROW ( 'Numbers of rooms'[Number of rooms] ),
                CONTAINSSTRING (
                    [UserNumberOfRooms],
                    'Numbers of rooms'[Number of rooms]
                )
            )
        VAR Proximity =
            FILTER (
                ALLNOBLANKROW ( 'Proximities to metro station'[Proximity to metro station] ),
                'Proximities to metro station'[Proximity to metro station]
                    <= IF (
                        ISBLANK ( [UserProximityToMetroStation] ),
                        10000,
                        [UserProximityToMetroStation]
                    )
            )
        VAR CorssjoinedTable =
            CROSSJOIN (
                CROSSJOIN (
                    CROSSJOIN (
                        PricesTable,
                        Neighbouroods
                    ),
                    Rooms
                ),
                Proximity
            )
        RETURN
            CorssjoinedTable
    ),
    "User ID", [User ID],
    "Price", [Price],
    "Neighbourhood", [Neighbourhood],
    "Proximity to metro station", [Proximity to metro station],
    "Number of rooms", [Number of rooms]
)

Once we have the fact tables we can create the relationship with the dimensions to get the model of the previous image.

It's now possible to define the two measure that can compute dynamically the numbers of matching users and apartments

We use the expanded tables to propagate the filters from the fact tables to the dimension, twice, since we need to propagate the filters through two fact tables

First from Aparmtents to Users

# Users =
CALCULATE (
    COUNTROWS ( Users ),
    CALCULATETABLE (
        'Users Fact',
        'Apartments Fact'
    )
)

Then from Users to Apartments

# Apartments =
CALCULATE (
    COUNTROWS ( Apartments ),
    CALCULATETABLE (
        'Apartments Fact',
        'Users Fact'
    )
)

We can also implement a measure returning a string with the matching apartments for the user

Apartments Match =
CALCULATE (
    CONCATENATEX (
        Apartments,
        Apartments[Apartment ID],
        ", "
    ),
    CALCULATETABLE (
        'Apartments Fact',
        'Users Fact'
    )
)

And of the users for the current apartment

UsersMatch =
CALCULATE (
    CONCATENATEX (
        Users,
        Users[User ID],
        ", "
    ),
    CALCULATETABLE (
        'Users Fact',
        'Apartments Fact'
    )
)

Since this technique creates fact tables using crossjoins, the cardinality can grow really fast and might become a problem when Users and Aparment sizes become important. One way to reduce the number of rows generated can be to use ranges with larger intervals, or maybe to implement something different :)

I hope I didn't make too many mistakes, since this answer got a bit longer than what I thought and I had to write it a bit in a hurry.
sergiom
  • 4,791
  • 3
  • 24
  • 32
  • I uploaded the sample pbix to my gihub, this is the link for the direct download https://github.com/SergioMurru/shared/raw/main/Mihai%20Enache%20Count%20with%20multiple%20criteria%20selection/Mihai%20Enache%20Count%20with%20multiple%20criteria%20selection.pbix – sergiom Dec 20 '20 at 16:37